Open-source Pingdom/UptimeRobot alternatives 2026
Open-source alternatives to Pingdom and UptimeRobot in 2026 — Uptime Kuma and Beszel for monitoring you host
TL;DR
- Pingdom, UptimeRobot, and StatusCake meter the things that matter most — how many checks you run, how often they run, how many teammates get access, and whether you get a real status page. The bill climbs as you grow.
- Uptime Kuma is the open-source tool that replaces them for the "is it up?" question: HTTP, TCP, ping, DNS, keyword, and push checks down to 20-second intervals, with status pages built in. It has 86.7k GitHub stars, an MIT licence, and is maintained by Louis Lam.
- Beszel answers a different question — "is the server healthy?" It tracks CPU, memory, disk, network, and per-container stats. Around 22k stars, MIT-licensed, built by the developer henrygd.
- Neither tool is a full traces-and-logs platform. For metrics dashboards and deeper analysis, pair them with Grafana and Prometheus.
- DANIAN runs Uptime Kuma for €9/month and Beszel for €9/month, flat. No per-check, per-seat, or per-status-page fees. A comparable SaaS setup with 1-minute checks, a branded status page, and a couple of teammates lands around $20–35/month and rises from there.
Why people are leaving Pingdom and UptimeRobot in 2026
The uptime-monitoring market prices on metering. UptimeRobot's free tier checks every 5 minutes; 60-second checks start at $7/month and a full status page needs the $29/month Team plan. Pingdom charges per check from $10/month and sells status pages as a separate product. StatusCake gates 1-minute checks behind its $20.41/month tier. The faster and broader you watch, the more you pay.
That metering is the trigger. Most teams start on a free tier, then hit a wall. The 5-minute interval is too slow to catch a short outage. Or they need a status page on their own domain. Or a second person needs alert access. The upgrade email arrives, and the flat figure they expected becomes a usage calculator.
There is a second reason teams move: ownership. Pingdom is now a SolarWinds product, and its pricing is per check — reviewers note that crossing the entry tier's 10-check limit can nearly triple the bill. When a tool you depend on is acquired or repriced, your monitoring history and your status page follow the vendor's roadmap, not yours. Self-hosting puts the history, the config, and the status page on infrastructure you control.
Here is what each tool meters, with current numbers.
UptimeRobot. The free plan gives 50 monitors at a 5-minute interval, one basic status page, and 3 months of data retention. The Solo plan starts at $7/month on the annual plan and drops the interval to 60 seconds. The Team plan is $29/month annually (about $348/year) and adds full-featured status pages, all 12 integrations, and 3 login seats — extra seats are $15/month each. The Enterprise plan starts at $54/month for 30-second checks. SMS alerts come from one-time credit packs, not the base plan.
Pingdom. Now part of SolarWinds, Pingdom has no permanent free tier. Synthetic monitoring starts at $10/month billed annually, or $15 month-to-month, for 10 uptime checks, 1 advanced check, and 50 SMS credits. Pricing is per check, so crossing 10 monitored endpoints moves you up a tier quickly. Status pages are a separate Pingdom product with their own price. The median Pingdom customer pays $296 per year.
StatusCake. The free plan is capped at a 5-minute interval. The Superior plan is $20.41/month for up to 100 monitors at a 1-minute interval, with page-speed, server, and domain checks. The Business plan is $66.66/month for 300 monitors at 30-second intervals. Status pages are sold separately, starting at $12.46/month and rising to $208.29/month for the white-label tier.
None of these prices are unreasonable for what they are. The pattern is the issue: every axis you care about — interval, check count, seats, status pages, SMS — is a separate line that scales with use. Self-hosting the open-source equivalent flips that. You run one instance, and the limits are your server's, not a price tier's.
What "alternative" actually means here
"Alternative" hides two different jobs. External uptime answers "is my site reachable from the outside, and can I show users a status page?" Server health answers "is the machine that runs my app healthy — CPU, memory, disk, network?" Uptime Kuma does the first job and replaces Pingdom, UptimeRobot, and StatusCake. Beszel does the second, which those uptime tools mostly do not.
The two answer different questions at different moments: Uptime Kuma pages you when customers cannot reach the checkout page; Beszel shows you the disk hit 100% an hour earlier, which is usually why.
The word also covers three different paths, and they are not the same purchase.
- A cheaper SaaS. You still rent, and you are still metered — just at a lower number until you grow into the next tier.
- Self-host the open-source tool yourself. The software is free. The server, the patching, the backups, the TLS renewal, and the on-call are yours.
- Managed open-source. Someone runs the open-source tool for you at a flat price, and you keep the data. This is what DANIAN does.
One honest boundary before the shortlist: neither Uptime Kuma nor Beszel is a full application-performance-monitoring platform with distributed tracing and log aggregation. If that is what you need, the open-source answer is Grafana and Prometheus, which we also run. Kuma and Beszel cover uptime and server health well; they are not pretending to be Datadog.
The shortlist
Uptime Kuma — the self-hosted answer to "is it up?"
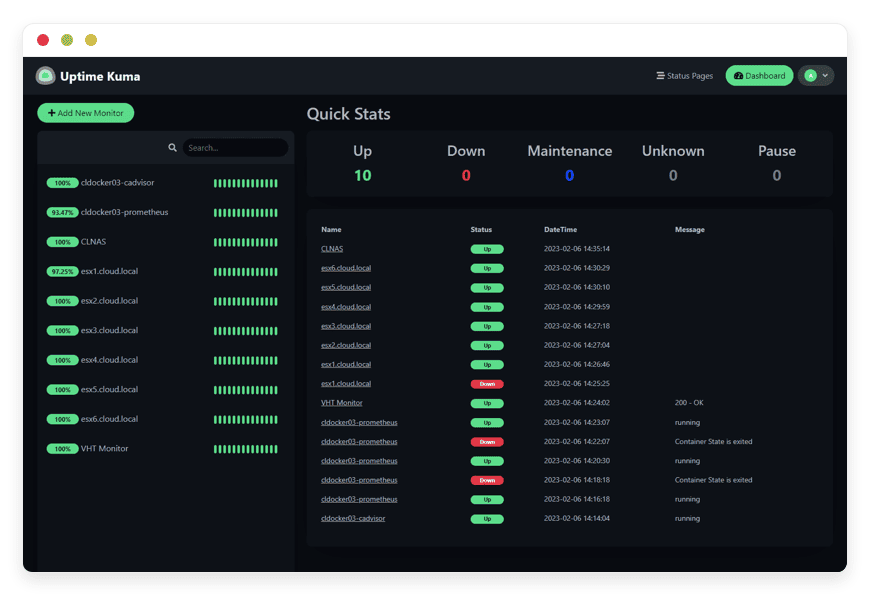
Uptime Kuma is an easy-to-use self-hosted monitoring tool with 86.7k GitHub stars and an MIT licence. Its maintainer, Louis Lam, built it as a self-hosted alternative to UptimeRobot. It monitors HTTP(s), TCP, ping, DNS records, keywords, JSON queries, WebSocket, push, and Docker containers, at intervals down to 20 seconds.
DANIAN runs it for €9/month. Best for: any team that wants "is it up?" and a status page they own.
The status-page support is the part teams care about. One instance can host multiple status pages and map each to its own domain, so you can show customers a clean page without buying a separate product. Each page can group monitors into sections, publish an incident or a planned-maintenance window, and show historical uptime percentages alongside the live state. You control the wording and the branding, because the page runs on your instance rather than a vendor's.
For alerting, Uptime Kuma sends through Telegram, Discord, Slack, Gotify, Pushover, email, and more than 90 other notification services, and you can route different monitors to different channels. It tracks certificate expiry, draws response-time charts, and supports two-factor sign-in.
One honest limitation: a self-hosted instance checks your endpoints from wherever you host it. That is one vantage point. A SaaS tool runs the same check from a global probe network, which helps confirm an outage is real and not local to one region. The fix is straightforward. Host the instance in a region near your users — an EU region, or any of 21 datacenter locations across six continents — on infrastructure separate from the app it watches. Then add a push check, so the app reports in on a schedule and a silent agent counts as down.
Beszel — lightweight server health
Beszel is a lightweight server-monitoring hub with historical data, Docker stats, and alerts. It has around 22k GitHub stars, an MIT licence, and is built by the developer henrygd. It has two parts: a hub (a small web dashboard built on PocketBase) and an agent that runs on each server you want to watch.
DANIAN runs the hub for €9/month. Best for: knowing the box behind your app is healthy.
Beszel tracks CPU, memory (including swap and ZFS ARC), disk usage, disk I/O, network throughput, and temperature for the host, plus CPU, memory, and network history for each Docker or Podman container. It raises configurable alerts on CPU, memory, disk, bandwidth, temperature, load average, and status. It supports multiple users, OAuth sign-in, and automatic backups to disk or S3-compatible storage. It is deliberately small and light to run. Recent releases added outbound heartbeat monitoring, so a Beszel hub can also alert when an external service stops checking in on schedule.
The key thing to understand is that Beszel is a different layer from Uptime Kuma, not a competitor to it. Kuma tells you a service stopped responding. Beszel tells you the disk filled up or the memory ran out — often the reason the service stopped. Many teams run both: Kuma for the outside view, Beszel for the inside view.
For full metrics dashboards and querying on top of either, that is where Grafana and Prometheus come in.
Uptime Kuma and Beszel vs the monitoring SaaS — at a glance
The table below sets the two open-source tools against the three SaaS products they replace. Prices are current as of June 2026; the SaaS figures are the lowest tier that delivers the listed capability, and they climb with check count, interval, seats, and status pages.
| Feature | Uptime Kuma (managed by DANIAN) | Beszel (managed by DANIAN) | Pingdom | UptimeRobot | StatusCake |
|---|---|---|---|---|---|
| What it watches | Endpoints, uptime, status pages | Server CPU, RAM, disk, network, containers | Endpoints, page speed, transactions | Endpoints, uptime, status pages | Endpoints, page speed, SSL, domain |
| Fastest check interval | 20 seconds | Continuous resource sampling | 1 minute | 5 min (free), 60 sec (paid), 30 sec (Enterprise) | 5 min (free), 1 min (Superior), 30 sec (Business) |
| Status pages | Unlimited, custom domains | Not applicable | Separate paid product | Basic (free), full (Team and up) | Separate paid product, from $12.46/mo |
| Pricing model | Flat €9/month | Flat €9/month | Per check, from $10/month | Per tier + per seat, $0–$54+/month | Per tier, $20.41–$66.66/month + status pages |
| Licence / stars | MIT / 86.7k | MIT / ~22k | Proprietary (SolarWinds) | Proprietary | Proprietary |
| You host it | Yes, in the region you choose | Yes | No | No | No |
| Switching effort | Low–medium: recreate monitors, point status-page DNS | Low: install agents on your servers | — | — | — |
The open-source tools win on interval, status pages, and a flat price. The SaaS tools win on one real thing: external checks from a worldwide probe network you do not have to run. Whether that matters is the first question to answer.
How to pick: three questions to ask yourself
Three questions decide this faster than any feature list. They are about what you need to know, not about which tool has the longest spec sheet. Answer them in order, and the choice between Uptime Kuma, Beszel, or both becomes obvious within a few minutes.
1. Do you need "is it up?", "is the server healthy?", or both? If you only need to know that your site answers and to show a status page, Uptime Kuma alone is enough. If you need to know the machine behind it is not out of memory or disk, that is Beszel. Most teams running their own apps end up wanting both, on two €9 instances.
2. Do you need checks from many places in the world, or from one reliable spot? If you truly need to confirm an outage from several continents at once, a SaaS probe network is a real advantage and worth paying for. If a single well-placed check is enough for your traffic, a self-hosted instance covers it — and you can run a second one in another region if you want a second opinion.
3. Who watches the watcher? Host your monitoring separately from the thing it monitors. If Uptime Kuma runs on the same server as your app, a server outage takes your alerting down with it. Put the monitor on its own instance, ideally in a different region, and add a push check so the app reports in. We set this up this way by default.
What it costs: the math
Take a common setup: roughly 20 endpoints, 1-minute checks, one branded status page on your own domain, and two or three people with access. On UptimeRobot that is the Team plan at $29/month, about $348/year. On StatusCake it is Superior at $20.41/month plus a status page from $12.46/month — about $33/month combined. On Pingdom, 20 checks pushes you past the entry tier, and the status page is extra again.
So a realistic SaaS bill for "monitoring plus a status page plus a small team" lands around $20–35/month and keeps rising as you add checks, shorten the interval, or add seats. That is $240–420 a year before growth.
Seats are the line that surprises people. UptimeRobot's Team plan includes three login seats, and each additional seat is $15/month — so a fourth person on call adds $180 a year on its own. A self-hosted instance has no seat meter: you create as many logins as your team needs, because the limit is your own user table, not a price tier.
DANIAN runs Uptime Kuma for €9/month, flat. Because it is your own instance, you get unlimited monitors, 20-second intervals, unlimited status pages on custom domains, and 90-plus notification channels, with no per-check or per-seat line. Add Beszel for server health at €9/month and you cover both layers for €18/month total. We patch the instance, back it up daily off-site, monitor it, and answer chat when you need us. Your time on operations is zero. In annual terms that is €216 a year for both layers, flat, against the $240–420 and climbing the SaaS route runs to — with no per-check, per-seat, or per-status-page line to track.
You can also run both tools yourself, and for some people that is the right call. Both are lightweight, so the hardware is modest. Budget a production-class VPS at around $24/month, an object-storage backup target, and your own time for patching, TLS renewal, and the occasional 2am restart, at a freelance rate of €60–120/hour. If you have a developer in-house who enjoys this, Coolify on that VPS is a genuinely good DIY path. The €9 is the rent plus the work; the bare VPS is only the rent.
Whichever path you pick, the data and the monitors are yours. We will not upgrade your instance or charge you more without asking first.
What switching looks like
Moving off a SaaS monitor is mostly re-entry, not migration. There is no database to lift and shift — you are recreating a short list of checks in a new tool. For Uptime Kuma, add each monitor by URL or host, set the interval and the notification channel, then point your status page's DNS at the new instance. Most teams finish in an afternoon.
For Beszel, you install the agent on each server you want to watch and it appears in the hub within a minute; there is nothing to import.
The safe way to cut over is to overlap. Keep the old SaaS account running and stand the new instance up beside it for a week. Watch that both fire the same alerts on the same incidents, confirm the status page renders on your domain, and only then cancel the SaaS plan. Leave one external push or heartbeat check in place as a backstop, so a problem with the monitor itself does not pass silently.
FAQ
Is Uptime Kuma really free?
The software is free and open source under the MIT licence, so there is no licence fee ever. What costs money is the server it runs on and the time to keep that server patched, backed up, and reachable. You can host it yourself on a VPS, or DANIAN runs it for you at €9/month with the operations included.
What is the difference between Uptime Kuma and Beszel?
Uptime Kuma watches your services from the outside: it checks whether endpoints respond and powers the status page your users see. Beszel watches your servers from the inside: CPU, memory, disk, network, and per-container stats. They cover different layers, so many teams run both — Kuma for "is it up?", Beszel for "is the box healthy?".
Can Uptime Kuma replace Pingdom or UptimeRobot entirely?
For uptime checks, alerting, and status pages, yes — that is exactly what Louis Lam built it to do. The one honest gap is global probing: the SaaS tools check from many locations worldwide, while a self-hosted instance checks from where you host it. Run it in a region near your users, or run a second instance, and that gap mostly closes.
Does this give me application performance monitoring, with traces and logs?
No, and it is worth being clear about that. Uptime Kuma is uptime monitoring and Beszel is server-resource monitoring; neither does distributed tracing or log aggregation. For metrics dashboards, querying, and deeper analysis, pair them with Grafana and Prometheus, which we also run at €9/month each.
How does this compare to running it on my own VPS?
You can self-host both tools. Plan on a production-class VPS at roughly $24/month, a separate backup target, and your own time for patching, certificate renewal, and upkeep. DANIAN's €9/month covers the server and all of that operational work. If you have a developer who likes running infrastructure, the DIY path is a fair choice.
What happens to my monitors and status pages if I leave?
They are yours to take. You can export your Uptime Kuma configuration and history and your Beszel data, then run them anywhere else. The open-source apps and their data belong to you; we operate them on your behalf, we do not lock them up. Leaving is an export, not a negotiation.
Can Uptime Kuma monitor internal or private services that are not exposed to the internet?
Yes, and this is a real edge over hosted SaaS. Because the instance runs inside your own network, it can check internal APIs, databases, and admin panels that never face the public internet. A cloud probe can only reach public endpoints. You decide what stays private and what is watched.
What types of checks and protocols does Uptime Kuma support?
Uptime Kuma checks HTTP(s), TCP ports, ping, DNS records, keywords on a page, JSON-query responses, WebSocket, Steam game servers, Docker containers, and push or heartbeat endpoints for jobs that report in. Intervals go down to 20 seconds. That range covers websites, APIs, mail servers, and cron jobs from one dashboard.
Can I run a public status page on my own domain with Uptime Kuma?
Yes. One Uptime Kuma instance hosts multiple status pages, each mapped to its own custom domain. You group monitors into sections, post incidents and planned-maintenance notices, and show historical uptime percentages. There is no separate status-page product to buy and no per-page fee, because the page runs on your instance.
How many notification channels does Uptime Kuma support, and can I get alerts on my phone?
More than 90 notification services, including Telegram, Discord, Slack, Gotify, Pushover, email, and webhooks. Phone alerts arrive through any of those apps, so you do not pay for SMS credits unless you want them. You can route different monitors to different channels and pause alerts during a maintenance window.
Can these tools feed into Grafana and Prometheus?
Yes. Uptime Kuma exposes a Prometheus-compatible metrics endpoint, so you can scrape its uptime and response-time data into Prometheus and chart it in Grafana. That is the path when you want long-term dashboards or to combine monitoring with other metrics. DANIAN runs Grafana and Prometheus at €9/month each.
What exactly does Beszel measure on a server?
Beszel tracks CPU, memory including swap, disk usage and disk I/O, network throughput, system load, and temperature for the host. For each Docker or Podman container it records CPU, memory, and network use. It stores this history automatically, so you can see trends over days and weeks without wiring up a separate database.
How lightweight is the Beszel agent?
Very light. The agent is a single binary that typically uses under 10 MB of memory and has no extra dependencies, so it runs comfortably on small VPS instances or a Raspberry Pi without competing with your actual workload. The hub that collects and displays the data is the part DANIAN runs for you.
Do I have to expose my servers to the internet to use Beszel?
No. Each Beszel agent reports outward to the hub over a secure connection, so the servers you monitor need no open inbound ports or public exposure. Only the hub has a web dashboard, and you reach that behind a login. The monitored machines stay private while you still see their health.
Can Beszel monitor Docker containers?
Yes, per-container monitoring is built in. Beszel reports CPU, memory, and network use for each Docker or Podman container alongside the host metrics, with no separate exporter to install. If a container stops, you see it. That makes it a fit for the containerised apps most small teams now run.
Do I need to know Docker or Linux to run these tools?
To self-host them, some comfort with Docker and a Linux server helps, since you install, update, and secure them yourself. If that is not where you want to spend your time, DANIAN runs both for you at €9/month each, including setup, updates, and backups, so you only use the dashboard.
Can multiple people on my team access the dashboards?
Yes. Uptime Kuma supports multiple logins with two-factor sign-in, and Beszel supports multiple users with OAuth. Because you host the instance, there is no per-seat charge: you add as many team logins as you need. Hosted tools often meter seats and bill extra for each person past the first few.
Can a self-hosted monitor check my site from multiple locations?
From one location by default, since it runs where you host it. Hosted tools check from a worldwide probe network, which helps rule out a regional network blip. You narrow that gap by hosting near your users, running a second instance in another region, and adding a push check so the app confirms it is alive.
What happens if the server running my monitor goes down?
If the monitor sits on the same machine as your app, one outage can take both down and you hear nothing. The fix is to run monitoring on its own instance, ideally in a different region, with a push check as a backstop. DANIAN runs your instance separately from your app and watches it for you.
Is my monitoring data private and only visible to me?
Yes. With a self-hosted instance, your checks, response times, and the list of what you monitor stay on infrastructure you control rather than a vendor's account. No third party sees your internal topology. When DANIAN operates the instance, the data still belongs to you and you can export it whenever you want.
Can I choose where my instance is hosted?
Yes. DANIAN runs across 21 datacenter regions on six continents, and you pick the one closest to your users or your other systems. Hosting the monitor near the things it watches keeps checks fast and cuts false alerts from long network paths. You can move regions later if your needs change.
What to do this week
Start with the question you need answered. If it is "is my site up, and can I show a status page?", spin up an Uptime Kuma instance and recreate your monitors. If it is "is my server healthy?", start with Beszel and install the agent. If it is both, run both — that is the full picture for €18/month.
You can try either one for 7 days without a card, keep your data if you stay, and export it if you do not. See managed Uptime Kuma hosting, look at Beszel for server health, or start a 7-day trial and have a monitor running today.