
Fully Managed Grafana
as a Service

Deploy Grafana as a fully managed service starting at €9/mo. Get automated backups, SSL, updates, support and monitoring included.

Grafana is the open-source observability and dashboarding platform — the place engineers go to see what their systems are doing right now. It queries metrics, logs, traces, and profiles from Prometheus, Loki, Tempo, Mimir, CloudWatch, Elasticsearch, and 170+ other sources, combining the convenience of Datadog or Grafana Cloud with the cost predictability and control of self-hosted infrastructure.

Free 7-day trial  99.9% Uptime SLA  No credit card  Cancel anytime

Free 7-day trial  99.9% Uptime SLA
No credit card  Cancel anytime

Grafana

Grafana

STARTING AT

€9/month
Automated Backups
Monitoring
Automated Updates
Auto SSL

USAGE

Unlimited
Human Support
Custom Domains
Terminal Access
File Manager Access
Deploy in your region 21 locations worldwide
GermanyFinlandNetherlandsUKSwedenUnited StatesCanadaSingaporeJapanAustraliaBrazilSouth Africa+9 more →
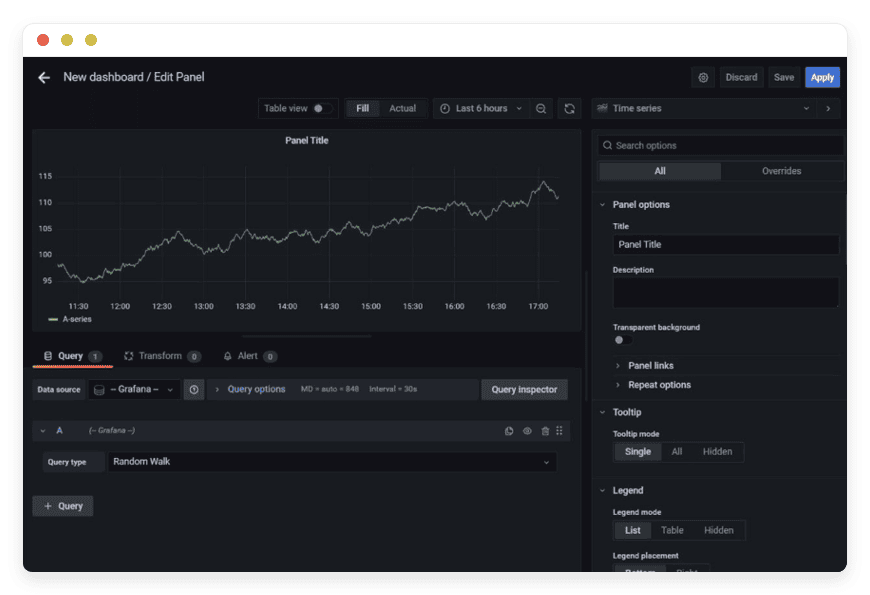
Grafana Preview Image

ABOUT THE SOFTWARE

What is Grafana

Grafana is the open-source visualization and alerting layer for time-series observability — a single pane of glass that queries metrics, logs, traces, and profiles from external data sources and renders them as dashboards. Started in 2014, now used by over 35 million people.

Grafana is released under the AGPLv3 license (since April 2021; previously Apache 2.0) and maintained by Grafana Labs, the company founded by Torkel Ödegaard and Raj Dutt in 2014. The repository carries 72.5k stars on GitHub and 66,000+ commits.

Grafana is the visualization layer in a broader open-source observability stack: Loki for logs, Tempo for distributed traces, Mimir for metrics at scale, Pyroscope for continuous profiling, and Faro for frontend telemetry — collectively the LGTM(F) stack. Public adopters disclosed in Grafana Labs' GrafanaCON 2026 press release include Anthropic, Bloomberg, NVIDIA, Microsoft, and Salesforce. Wikimedia, CERN, JAXA, and the Schwarz IT group (6,000+ dashboards across 100+ orgs) run Grafana on public or near-public infrastructure.

FEATURES

What Grafana does

Grafana is the visualization, alerting, and exploration UI for time-series observability data. It speaks to 170+ data sources, renders dashboards as code or in the UI, runs unified alerting against any datasource, and exports both as live web pages and as scheduled PDF reports.

170+ data sources

Connects natively to Prometheus, Loki, Tempo, Mimir, CloudWatch, Elasticsearch, InfluxDB, Postgres, MySQL, BigQuery, ClickHouse, Snowflake, and 170+ other backends. Mix datasources on the same dashboard.

Dashboards as code

Dashboards live as JSON, provisioned from Git via Grafana 13's Git Sync (GA April 2026). Datasources and folders provision via YAML. Roll changes back the same way you roll back code.

Image renderer (sidecar)

Bundled container that renders panels as PNG or PDF for scheduled email reports, alert-attached screenshots, and stakeholder reporting. Uses Chromium under the hood — properly sandboxed.

Plugin ecosystem

Hundreds of community panel plugins (clock, traffic light, sankey, calendar heatmap), datasource plugins (Zabbix, Snowflake), and app plugins. Signed plugins install at one click; we vet unsigned ones on request.

Unified alerting

Multi-dimensional alert rules against any data source, with contact points to PagerDuty, OpsGenie, Slack, Microsoft Teams, email, and webhooks. Routes, mute timings, and silences in one UI since legacy alerting was retired.

Explore mode

Free-form query interface for ad-hoc investigation across metrics, logs, and traces. Correlated trace-to-log jumps, click-through from a service map into the relevant log lines, exemplars pulled into flame graphs.

OAuth, SAML, LDAP, OIDC

Single sign-on via GitHub, Google, GitLab, Okta, Auth0, Azure AD, generic OIDC, generic SAML, or LDAP / Active Directory. Pre-configured for the protocol you choose at trial start.

Public dashboards

Share a read-only dashboard URL externally without exposing your Grafana instance. Anonymous-viewer access for shop-floor TV panels or stakeholder portals, controlled per dashboard.

WHAT'S ALWAYS INCLUDED

Every app. Fully managed.
Nothing extra to pay for.

Every app you deploy includes the full managed service — security, backups, updates, and support from day one.

Automatic updates and patches

Apps run the latest stable version. Security patches applied silently, with rollback if needed.

Daily off-site backups

Multiple daily backups in redundant off-site locations. One-click restore if anything goes wrong.

24/7 uptime monitoring

Continuous monitoring with instant alerting. We respond before you notice.

SSL, firewall, DDoS protection

Auto-renewing SSL, hardened firewall rules, DDoS mitigation on every deployment.

Performance and scaling

We monitor resource usage continuously. When your app needs more headroom, we flag it and upgrade with your explicit approval.

Dedicated engineering support

Real engineers on chat. DNS, SMTP & migration help. All included in €9.

WHY MANAGED

Why teams pick managed Grafana

On September 1, 2024, Grafana Cloud moved Application Observability to host-hours billing. On February 13, 2026, the new pricing model added $0.025 per host hour plus $0.50 per 1,000 active series, with no telemetry credits. Small fleets running their own Prometheus and Loki suddenly had a reason to leave Grafana Cloud.

Running Grafana yourself is straightforward — until it isn't. The default SQLite backend works for one replica and silently caps your ability to run high availability. Grafana's own docs say it plainly: SQLite isn't recommended for production, and high availability requires either MySQL or PostgreSQL. The migration path between them is well-documented and full of sharp edges — alert.silenced data types, dashboard UID conflicts, datasource provisioning collisions. Everyone who reaches a second replica eventually rebuilds the backend.

We ship Grafana with the work already done. The database backend is Postgres, not SQLite, with daily off-site backups and managed point-in-time recovery. The Grafana binary is pinned to the tested release, not latest. Anonymous access is disabled, admin password reset is forced on first login, and root_url is configured for your custom domain before you log in.

REVIEWS

Hear from customers ​like you​​​​​​​

Successful businesses and professionals around the world rely on DANIAN every day

USE CASES

Three teams who run Grafana on DANIAN

These are representative team types we set up most often. Each starts with the same flat €9 plan.

12-PERSON FINTECH SRE TEAM

Migrating off Datadog after the Q4 invoice

Series-B payments infrastructure across two AWS regions. Region: Finland for proximity to major venue matching engines. Postgres backend with managed PITR backups. Grafana Enterprise license for the Snowflake datasource plugin. SAML SSO via Okta. Dashboards provisioned via Git Sync. Prometheus + Mimir + Loki + Tempo as datasources, PagerDuty contact point for P0 latency alerts.

4-PERSON OT/IT BRIDGE TEAM

Correlating PLC tags with cloud telemetry for 18 factory floors

German automotive supplier. Region: Germany for sub-50ms RTT from on-site OPC UA gateways. InfluxDB for 1Hz sensor scans, TimescaleDB for batch-process telemetry, Prometheus for the edge Kubernetes stack running Node-RED, Loki for PLC event logs. LDAP auth against the corporate Active Directory. Image renderer bundled for the weekly OEE PDF mailed to plant managers.

8-PERSON MSP, 30 CLIENTS

Running per-tenant Grafana for SMB clients in two regions

Region: US for US clients, Singapore for APAC clients. One Grafana per tenant with strict org isolation. OAuth via Auth0. Datasources provisioned via YAML so each customer's Prometheus is pinned at install. Image renderer enabled for monthly white-labeled SLA PDF reports. SMTP routed through our transactional relay so alert emails don't bounce.

COMPARISON

Four ways to run Grafana

The math: at the small-team scale most engineering shops actually live in, four paths exist. Grafana Cloud, a self-hosted VPS, a home or office server, and DANIAN managed Grafana. At 1, 5, and 10 users with a realistic 10k-active-series workload, the totals differ by an order of magnitude.

 PATH1 USER5 USERS 10 USERSOPERATIONAL TIME
Grafana Cloud Pro 
Hosted by Grafana Labs · per-user + per-series + per-host-hour
$0 (Free tier, capped 3 users)~$35/mo + series overages$75–500/mo realistic0 h/mo
Self-host on a VPS 
DIY Grafana on a $24/mo production-class VPS
~€60–100/mo*~€80–160/mo*~€120–280/mo*2–4 h/mo
Home server 
Synology DS923+ or HP ProLiant ML30 Gen10
~€210–400/mo**~€250–500/mo**~€300–667/mo**2–4 h/mo
DANIAN Managed Grafana€9/mo€9/mo€9/mo0 h/mo

 *VPS path: $24/mo VPS + ~$5 object-storage backup + ~$15 production monitoring + €60–240/mo time at €60–120/hr.

**Home server: €18–55 hardware amortised over 36 months + €17–32 electricity + €40–80 business internet with static IP + €10–20 off-site backup + €120–480 operational time.

Grafana Cloud's per-series and host-hours billing scales linearly with your fleet — fine at three hosts and one user, expensive at thirty hosts and ten users. The VPS path is honest at €60–80/month for one user, but the operational time line item is the part nobody budgets for. The DANIAN row is flat at €9/month regardless of users, hosts, or active series — the math is the same whether you're a one-person SRE or a ten-person platform team.

BY INDUSTRY

Grafana for specific industries

Grafana sits at the visualization layer for any industry that runs time-series telemetry — but the operational practice changes sharply by sector. Retention horizons, alert cadence, datasource mix, and reporting cadence all shift. These four industries put specific demands on a managed Grafana that generic dashboarding software doesn't surface.

Regulatory anchor: MiFID II Article 25 trade-and-order data retention obligation of five years across regulated trading venues.

DANIAN configuration: Postgres backend with WAL archival to a separate region, Grafana Enterprise license activated for SAML SSO and the Snowflake datasource plugin, region pinned to Germany or UK per the client's data-residency clause.

Workflow: dashboards for FIX-session latency percentiles (p50/p95/p99), reject-rate per venue, settlement-batch SLO, post-trade reconciliation drift. Alerts on p99 above 50ms, order-throughput drop over 30% minute-over-minute, or a venue connection drop.

Quantifiable: five-year metric retention in Mimir, 50–200 services monitored per desk, ~150 alert rules per trading book, 10–25k active series typical. The retention horizon is the part Grafana Cloud's per-series pricing punishes most.
Operational standard: ISA-95 (MES/ERP separation) and IEC 62443 for OT cybersecurity zones.

DANIAN configuration: InfluxDB and Prometheus dual datasources for high- and low-frequency telemetry, dedicated VLAN/VPN egress from plant gateways to the managed instance, anonymous-viewer dashboards on a dedicated org for shop-floor TV panels, LDAP auth against the corporate Active Directory.

Workflow: OEE (Overall Equipment Effectiveness) panels per production line, per-shift throughput, vibration anomaly heatmaps from accelerometer rollups, predictive-maintenance trend dashboards feeding work-order tickets in SAP PM. Weekly OEE PDF mailed to plant managers via the image renderer.

Quantifiable: 1Hz–10Hz sensor sampling, two-year on-prem retention for ISO 9001 traceability, 200–2,000 PLC tags per line. The image-renderer bundling is what makes the weekly PDF workflow viable without a separate engineering project.
Operational methodology: Google's SRE SLI/SLO discipline, error-budget burn rates, blameless postmortems.

DANIAN configuration: Git Sync provisioning for all dashboards (GA in Grafana 13 since April 2026), Prometheus + Loki + Tempo as the standard datasource trio, OAuth via GitHub or Google so every engineer logs in with their existing identity, Postgres backend tuned for 100+ concurrent dashboard viewers.

Workflow: RED dashboards (Rate, Errors, Duration) per microservice, error-budget burn alerts routed to PagerDuty, deploy-correlation overlays via Grafana annotations from the CI/CD pipeline, on-call runbook links embedded in alert templates.

Quantifiable: 50–500 microservices monitored, 100k–1M active series across the fleet, 14-day to 90-day metric retention, ~30 SLOs across the platform. This is Grafana's native habitat — the migration cost from Grafana Cloud is almost entirely dashboard JSON export.
Operational standard: per-client data-processing agreements with strict tenant isolation requirements; per-client SLA-reporting cadence.

DANIAN configuration:
one Grafana instance per tenant with separate Postgres schemas, org-level role-based access for the MSP's own staff across tenants, region-of-record per client contract, OAuth via the MSP's own Auth0 or Okta tenant.

Workflow: per-client SLA dashboards (uptime, ticket-resolution time, patch-compliance percentages, backup-success ratios), monthly white-labeled PDF reports mailed automatically via the image renderer with the client's logo on each page.

Quantifiable: 10–50 clients per MSP relationship, ~100–500 dashboards per tenant, monthly PDF report cadence. The reason a single shared Grafana doesn't work here is tenant isolation — one client's noisy neighbor shouldn't bleed query latency into another client's dashboards.

FAQ

Frequently asked questions

Everything teams ask before signing up — answered straight, without sales speak.

Three groups: technical setup, migration, and how DANIAN works as a service.

01

Technical and configuration

Yes. Connect any data source Grafana supports — your own Prometheus, Loki, Tempo, Mimir, InfluxDB, CloudWatch, BigQuery, ClickHouse, Snowflake, or any of the 170+ Grafana datasource plugins. We don't run the metrics or log backends ourselves — Grafana on DANIAN is the visualization layer over whatever telemetry you already collect.
We run Grafana on PostgreSQL, not SQLite. Grafana's own docs say SQLite isn't recommended for production and that high availability requires MySQL or Postgres. We pin Postgres, tune the connection pool (max_open_conn = 100, max_idle_conn = 25), and back the database up daily off-site to a separate region. Restore is a chat message away.
Yes. Signed plugins install through the Grafana UI with a click. Unsigned plugins from GitHub require enabling them in grafana.ini under [plugins]allow_loading_unsigned_plugins — we'll do that for specific plugins on request after a quick review. Plugin signing was introduced in Grafana 8 and is enforced by default.
All of them. Configure GitHub, Google, GitLab, Okta, Auth0, Azure AD, generic OIDC, generic SAML, or LDAP / Active Directory via grafana.ini or environment variables. We pre-configure the protocol you specify when you start your trial — send the client ID, client secret, and any role-mapping rules, and we'll wire it up.

02

Migration and onboarding

We can activate your app on your own custom domain/subdomain. Examples: mydomain.com, anyword.mydomain.com.
Or, on our randomized free subdomain. Example: 963.apps.danian.cloud
If you wish to use a custom domain/subdomain, select that option when ordering your app (or notify us later). We will send you the required DNS records and if needed, our tech team will modify them for you.
21 datacenter locations across six continents. You choose the region at provisioning. Application data sits in the region you choose; pick whichever is closest to your users or matches your data-residency preference.
Yes. Request a region migration from the dashboard and we run the move in the background. The system emails you when the migration completes; total transfer time depends on data volume but typical instances finish in a few hours. There is no extra charge for a region change.
Yes. Full data export is available at any time, in a portable format you can bring to any infrastructure.
Export dashboards as JSON from your current Grafana (Settings → JSON Model → Save) or use the Grafana API to bulk-export.
Yes. Grafana 13's Git Sync (GA April 2026) is enabled on every DANIAN managed Grafana. Point it at your dashboard repo, define the branch and path mapping, and dashboards sync on every commit. Datasources via the YAML provisioning path, dashboards via Git Sync — same Git, same review process as your application code.
Yes — and unified alerting rules are stored in dashboard JSON or via the Grafana provisioning API, so they migrate with the dashboards. Contact points (PagerDuty keys, Slack webhooks, SMTP) need to be re-entered for security reasons; we walk through that during onboarding.
Yes. Start the 7-day trial, connect your existing Prometheus / Loki / Tempo as datasources (read-only), import your dashboards, and verify everything renders. When ready, cut DNS over — the trial instance is the same instance you keep. No migration day, no parallel-run cost.

03

Billing, support, and platform

€9 covers everything we do for that app: hardware in the region you choose, daily off-site backups with one-click restore, automatic security patches and version upgrades, 24/7 monitoring, SSL and firewall, and engineering support on Email/LiveChat. There are no setup fees or hidden line items. For more info see our Pricing page.
If you decide to continue, we charge €9/app/month from day 8. If you don't, the trial ends and you can export your data. No card is required for the trial, and we never auto-charge you without explicit consent.
No. The €9/month is flat regardless of how many users log into your app. Add 5 users or 50; the price doesn't change.
24/7 Live chat and email support, both staffed by engineers who run the systems. We handle DNS configuration, SMTP setup, app integrations, performance tuning, troubleshooting, and migration help. Response time is typically under an hour. There is no tier system — every customer gets the same support.
Yes. Cancel from the dashboard. We don't charge a cancellation fee, we don't lock data, and we will export your data to you on request before deletion. data to you on request before deletion.
Every customer instance is backed up daily to a separate region from the primary. We test restores. You can request a restore at any backup point within the retention window — usually 7 days for daily backups.
Your application data sits in the region you choose at provisioning — 21 datacenter locations across six continents. Account-level data (billing, account email, support ticket history) is processed centrally. Application data region is picked by you, per app.
99.9% uptime SLA on every app, every tenant. Service credits are documented at danian.co/service-level-agreement. The status page is located at status.danian.co.
When your tenant approaches the resource ceiling — the base tier holds 1 vCPU/RAM, 30 GB storage — we notify you. Resource upgrades happen with your explicit consent; we will not upgrade your tenant or charge you without it.
We wait. We don't suspend the app or delete your data on the first failed charge. We email you, you fix the card on file, and we continue.
Invoices can be downloaded from the billing dashboard in PDF the day each charge succeeds. EU VAT is added where applicable and the VAT-reverse-charge regime applies for VAT-registered businesses with a valid number.
150+ open-source apps across automation, team chat, file sync, analytics, AI, password management, email marketing, dev tools, project management, smart home, CMS, and federated social. See the full catalog →
Yes. Every instance comes with a web-based terminal and a file manager in your DANIAN management dashboard. Useful for managing your data and customizations.
Resources scale with your usage. If your app needs more vCPU, RAM, or storage, we add it — and we ask first before any change to your plan. €9 is the floor; resource-heavy workloads may price higher, but you'll always know in advance.
Yes. We have both a Partner program and an Affiliate program available. Anybody can sign up.
No contract. No minimum commitment. Cancel anytime from the dashboard with one click. The 7-day free trial requires no credit card. After the trial converts to paid, you can still cancel at any month without notice or penalty.

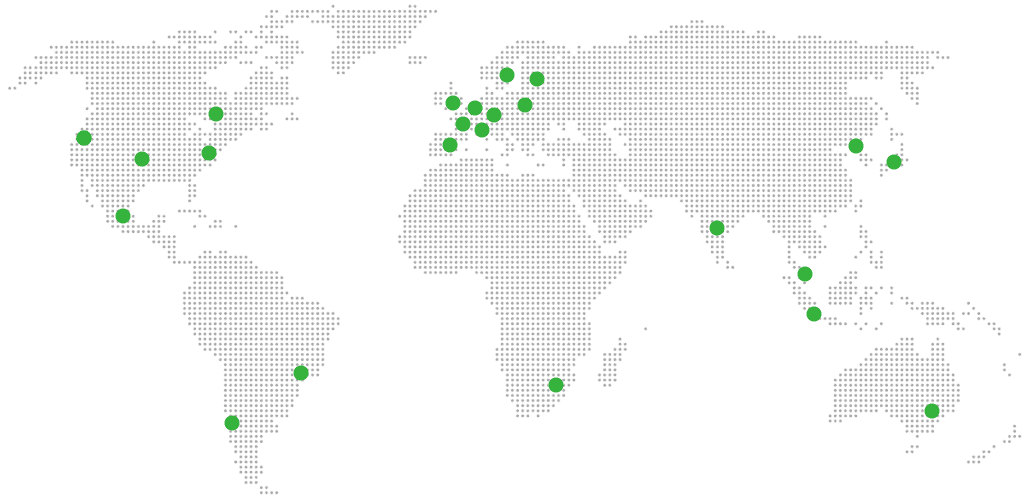
DEPLOY IN YOUR REGION

21 datacenter locations on six continents

Pick the region closest to your users.

United States, Germany, Finland, Singapore, Australia, Brazil, Canada, Netherlands, UK, Spain, Italy, France, Sweden, Malaysia, India, Japan, Mexico, Poland, South Korea, Chile, South Africa and more coming soon

Global Reach Map

Try managed Grafana for 7 days

No card. Cancel from the dashboard.