
Fully Managed Prometheus
as a Service
Deploy Prometheus as a fully managed service starting at €9/mo. Get automated backups, SSL, updates, support and monitoring included.
Prometheus is the open-source monitoring and time-series database that started at SoundCloud in 2012 and became the second graduated project at the Cloud Native Computing Foundation — metrics collection, PromQL queries, alerting, and dashboards — combining the cost discipline and portability of self-hosted infrastructure with the production-grade reliability that engineering teams used to outsource at multiple times the price.
✓Free 7-day trial ✓99.9% Uptime SLA ✓No credit card ✓Cancel anytime
✓Free 7-day trial ✓99.9% Uptime SLA
✓No credit card ✓Cancel anytime

Prometheus
STARTING AT
USAGE
 Germany
 Finland
 Netherlands
 UK
UK Sweden
 United States
 Canada
 Singapore
 Japan
Japan Australia
 Brazil
 South Africa+9 more →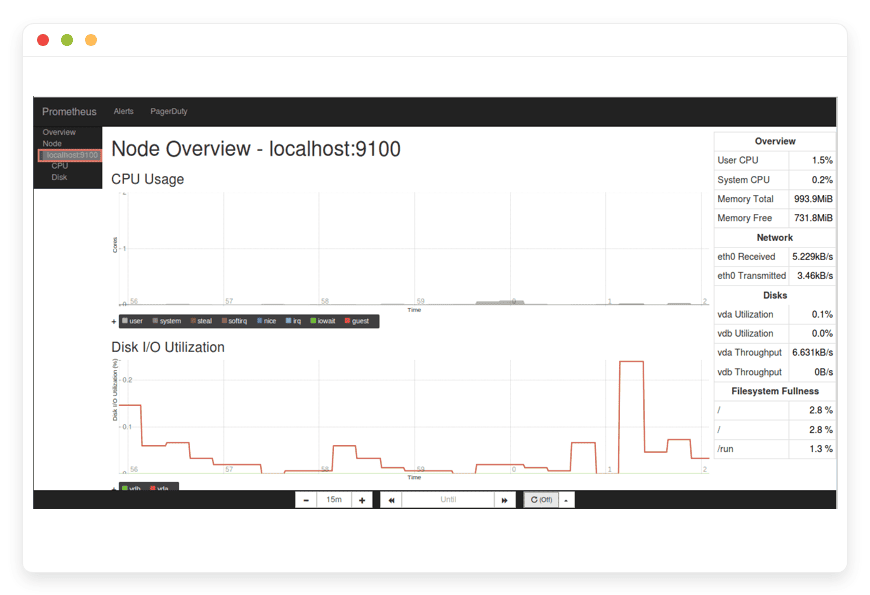
ABOUT THE SOFTWARE
What is Prometheus
FEATURES
What Prometheus does
WHAT'S ALWAYS INCLUDED
Every app. Fully managed.
Nothing extra to pay for.
Every app you deploy includes the full managed service — security, backups, updates, and support from day one.
WHY MANAGED
Why teams pick managed Prometheus
REVIEWS
Hear from customers like you

No more maintenance headaches!
Finally, I can relax and not bother with maintenance. Each of the softwares that we run on DANIAN is automated and running stable for couple months already. They even assist us with modifying the DNS records. Once we needed to modify the config of Nextcloud so that we are able to upload higher than 5GB files and they assisted us fast. I also love their documentation!

Kevin Blackwell

Best managed service
I previously ran Peertube, Mastodon, Mattermost and Mirotalk on other providers before switching to DANIAN. I was tired of handling the updates and backups myself. Not only that the performance is "out of this world" fast, but their tech support is amazing. Since then I added 5-10 more Apps on my account. I also love how they add more softwares on their list constantly!

William Northfield

Love the personalized service!

George Adams
n8n runs excellent

David Hartmann

Smooth experience
I needed a way to manage the projects and files for my company. This was the first time I learn about opensource. I asked their support team and they assisted me immediately. I started with Openproject. Later I added Nextcloud. My team were able to get used to the apps fast.

Levi Nilsson

Bye GA

Wyatt Mitchell

Love the freedom
I wanted to use a crm for my startup. I signed up for the free trial. Tried out espocrm and dolibar and picked one. Their dashboard is very easy for a beginner. I recommend them and feel confident in choosing them.

Elias Koch
Wow just wow
After discovering DANIAN, I wished I'd found them sooner — their solution is excellent and deserves wider recognition. Very good solution!

Tyler Hollander
Professional tech support!

Bastian Engel
Their support team is the best!
I had a problem with my card and the subscription could not be renewed in time. I notified their support and surprisingly, they showed much understanding. They basically left my apps run until I solved the card issue. Other providers would have deleted my data in a heartbeat. This is the way to build client-vendor trust!
George Adams
Fair price and fast
4 months ago I activated n8n, Uptime kuma, Vaultwarden and Paperlessngx. So far everything is perfect. The performance of all apps is excellent. I contacted their support team couple times for using custom subdomains for the apps and they were fast and kind. I'm constantly recommending them to my network!

Atanas

Vaultwarden 10/10
I wanted to selfhost a passwords manager for my company but I didn't trust the mainstream providers. I tried out Vaultwarden for the free trial. I loved how their support team communicated with me professionally but still kind. I know that I can contact them whenever with whatever question I have. Recommended!

James Smith
Multiple locations options

Edward Nelson
Everything just works!
My focus is on my business, not running servers. I love that I can lauch any app without having to think about the tech behind it. Everything just works!

Tony Roy
Awesome support team!

Filip

Very proactive!
Today couple of the videos on my Peertube got viral. Before I even noticed, their support have notified me via email that they proactively upgraded my app with more cpu & ram so that it continues to work without any downtime. They left the upgraded app with the added resources for couple days until the traffic stabilizes. After that I had the possiblity to stay on the same plan or keep the upgraded plan. Out of gratitude I stayed on the upgraded one.

Luke Hall

Win-win!
I run a web design biz. After I perform the work for my clients, they constantly ask me for more software solutions. So I partnered with DANIAN. Not only I provide the requested softwares for my clients and get the increased revenue boost by delegating all to DANIAN, but also for those clients that wish to order directly from DANIAN, I send them an affiliate link. Win-win on all sides!

Luke Walker

Jeffrey Johnson
Awesome customer service
I needed to add analytics on my website but I didn't know anything about DNS. Their team guided me at all phases and they performed the changes for me. Additionally they were transparent and notified me of every change applied and steps performed.

Gabriele Marino

Good admin dashboard
Not only that I got Chatwoot, I also have access to the management dashboard. I love that I can view my hourly/daily usage and perform manual backups and restorations if needed. I don't need the level of control but it feels good to know that I have it if I need it.

Matthew Turner

Andreas Schmitt
Great service!
I configure custom Matomo tracking for my clients as a monthly service. Many of my clients were asking if they can selfhost Matomo instead of using the Cloud service. My employee recommended DANIAN. Basically, I can activate as much Matomo's in any of 20+ countries the same day. Additionally the affiliate revenue is a nice bonus.

Jacob Turner
Smooth experience
I was listing through youtube tuts on how to install Bookstack myself. Then randomly, I found their video playlist exactly for Bookstack. Got curious and went at their website. For the same price (or higher) that I would pay for just the VPS, with them I'm getting a fully managed Bookstack. It's a no-brainer decision!

Elias Gustafsson


Mason Hayes
Its a great service
Its a great service. I love the performance of my Mastodon community. It keeps on growing and I don't have any worries about backups, secuirity, updates, etc.

Vinícius Rocha

Very intuitive solution!
I wanted to use a nocode software for my company. A friend recommended them so I tried both Baserow and NocoDB, couple days later picked one.

Haruto Hashimoto


Henrik Otto
USE CASES
Three teams who run Prometheus on DANIAN
These are representative team types we set up most often. Each starts with the same flat €9 plan.
12-PERSON SAAS ENGINEERING TEAM
Running 80 microservices on Kubernetes with 300k active series
The team scrapes about 200 targets across 80 microservices, holds 30 days of metrics locally, and federates older data to a long-term Thanos store. Region chosen for latency to the primary EKS cluster (Germany). Cardinality controlled by labeldrop on pod, pod_template_hash, and controller_revision_hash. Alerts route through Alertmanager to PagerDuty. Grafana datasource points at Prometheus directly so dashboards stay fast under burn-rate queries.
5-PERSON PLATFORM TEAM AT A PAYMENTS COMPANY
40 hosts with 90-day local retention and 12-month federated retention
Auth-failure rates and transaction-latency histograms route through a separate Alertmanager receiver to Opsgenie. Region pinned for data-locality reasons. Recording rules pre-aggregate sum by (service) (rate(http_requests_total[5m])) so dashboards never hit raw cardinality. Two Alertmanager replicas with --cluster.peer for deduplication. Remote write to a customer-owned Thanos receive endpoint handles the 12-month tail. Scrape interval at 30 seconds for cost discipline.
6-CLIENT OBSERVABILITY AGENCY
One Prometheus per client, region-pinned, tenant-labelled
Six client production stacks, each with their own Prometheus instance pinned to the client's preferred region. External labels carry tenant="" for downstream routing. Authentication terminates at a reverse proxy because Prometheus has no native RBAC. Per-tenant Alertmanager configurations route to each client's incident channel (Slack, Teams, or email). A central Thanos Querier fans out across tenants for the agency's monthly usage reports.
COMPARISON
Four ways to run Prometheus
There are four common ways to run Prometheus in production: pay a proprietary observability vendor by the host, rent a production-class VPS and run it yourself, run it on your own hardware at home or in a small office, or have us manage it for €9 per month. The math turns out different than most teams expect.
| PATH | 1 HOST | 5 HOSTS | 10 HOSTS | YOUR TIME |
|---|---|---|---|---|
| Proprietary SaaS Datadog Infrastructure Pro at $15/host/month annual | $15/mo | $75/mo | $150/mo | None — but APM adds $31/host, custom metrics add $5/100, and logs bill separately. Scales linearly with hosts. |
| Self-host on a VPS 2 vCPU / 4 GB production-class VPS (~$24) + $5 object-storage backup + $15 monitoring | $44/mo | $44/mo | $44/mo | 1–4 hours / month at €60–120 per sysadmin hour = €60–280 effective. DB tuning adds at 25+ targets. |
| Home server Synology DS923+ (~€650) amortised over 36 months + electricity + static-IP business internet + off-site backup | €100–200/mo | €150–300/mo | €200–400/mo | 2–4 hours / month. Plus a closet that can't be on a residential breaker, and a WAL replay that locks you out at 3am. |
| DANIAN Managed Prometheus | €9/mo | €9/mo | €9/mo | 0 hours / month. Patching, monitoring, backups, and a human reply included. |
BY INDUSTRY
Prometheus for specific industries
Five industries account for most production Prometheus deployments on DANIAN. Each puts distinct demands on retention, scrape cadence, label hygiene, and alerting — and pulls a different configuration choice from the same binary. The industry list below varies per app; what Prometheus needs in payments is not what it needs in real-time gaming.
FAQ
Frequently asked questions
Everything teams ask before signing up — answered straight, without sales speak.
Three groups: technical setup, migration, and how DANIAN works as a service.
01
Technical and configuration
02
Migration and onboarding
03
Billing, support, and platform
DEPLOY IN YOUR REGION
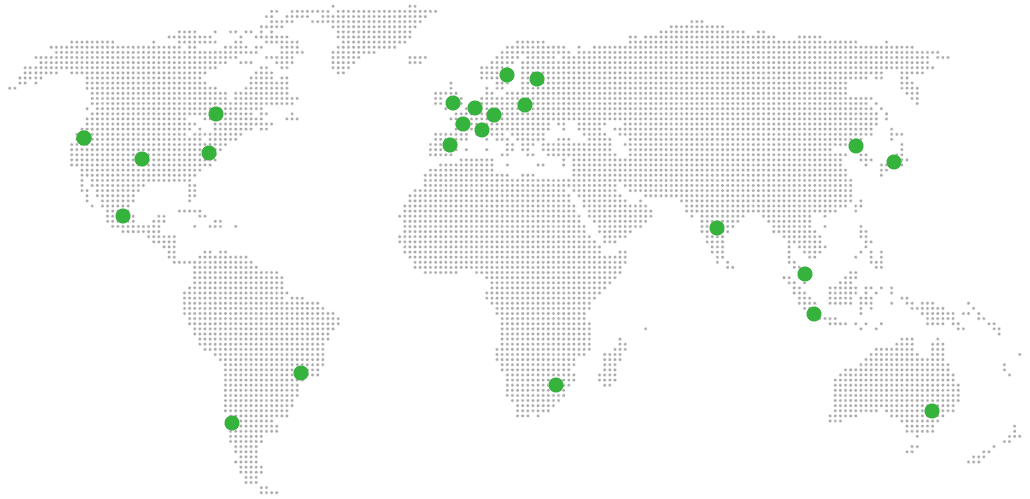
21 datacenter locations on six continents
Pick the region closest to your users.
United States, Germany, Finland, Singapore, Australia, Brazil, Canada, Netherlands, UK, Spain, Italy, France, Sweden, Malaysia, India, Japan, Mexico, Poland, South Korea, Chile, South Africa and more coming soon
Try managed Prometheus for 7 days
SERVICES
COMPANY
RESOURCES
COMPARE


