Reselling managed Uptime Kuma in 2026
How agencies and MSPs resell managed Uptime Kuma
Uptime monitoring is one of the easiest recurring lines an agency or MSP can add to a retainer. This guide shows how to resell managed Uptime Kuma — the open-source monitor with 87,000+ GitHub stars — at €9 wholesale per client, with a branded status page included, and what the margin looks like once you have 25 clients on it.
TL;DR
- Run one managed Uptime Kuma instance per client at €9/month wholesale. Sell it at €15–40/month retail.
- At 25 clients, that is €375–1,000/month in recurring revenue, before your support time.
- Pingdom, UptimeRobot, StatusCake, and Better Stack meter checks and charge per seat. Managed Uptime Kuma is one flat cost per client, with unlimited monitors inside each instance.
- Each instance carries its own status page, on your client's own domain. That is the white-label surface clients actually see.
- Honest boundary: Uptime Kuma does up/down checks, certificates, and status pages — not tracing or log aggregation. For that, pair it with Grafana.
The agency math
The model is simple. You pay €9/month for one managed Uptime Kuma instance per client. You charge the client €15–40/month as part of their retainer. That is €6–31 of gross margin per client, every month, for a line item you barely touch once it is running.
Ten clients on the monitoring line is €150–400/month in gross revenue. Twenty-five clients is €375–1,000/month. Your wholesale cost at 25 clients is €225/month, so the gross margin sits between €150 and €775/month. Subtract your own support time — a few minutes per client per month once instances are set up — and the net is still a clean recurring line.
| Per-client economics | Amount |
|---|---|
| Wholesale (you pay DANIAN) | €9 / client / month |
| Retail (you charge the client) | €15–40 / client / month |
| Gross margin per client | €6–31 / month |
| 10 clients — gross revenue | €150–400 / month |
| 25 clients — gross revenue | €375–1,000 / month |
| 25 clients — your cost | €225 / month |
| 25 clients — net margin | €150–775 / month |
The contrast that makes this work is how the proprietary monitors price. They meter the number of checks and charge per seat for team features.
| SaaS monitor | Entry paid price | How it's metered |
|---|---|---|
| Pingdom (Synthetic) | from $15/mo (10 checks) | per check; ~$95/mo at 90 checks |
| UptimeRobot | Solo ~$7/mo; Team ~$29/mo (100 monitors) | per monitor tier + $15/mo per extra login seat |
| StatusCake | Superior ~$24.49/mo (100 monitors) | per monitor tier; status pages billed separately |
| Better Stack | from $29/mo (50 monitors) | per 50 monitors + per-responder seat |
Pingdom's Synthetic plan starts at $15/month for 10 uptime checks and climbs toward $95/month at 90 checks. UptimeRobot's Team plan is about $29/month for 100 monitors and includes three login seats; extra seats are $15/month each. StatusCake's Superior plan is about $24.49/month, and status pages are sold as a separate product. Better Stack starts at $29/month for 50 monitors and adds a per-responder seat charge.
A managed Uptime Kuma instance has none of that metering. One instance monitors as many endpoints as its resources allow, with its own status page, for €9. You set the retail price; the spread is yours. You can see managed Uptime Kuma at €9/month on its product page.
How to package it for clients
The €9 wholesale number is the floor. What you charge depends on how you package the line, and a little structure here protects your margin. Three patterns cover most agencies.
Bundle it into the retainer. The simplest move is to fold monitoring into an existing care plan and raise the monthly fee by €15–25. The client sees one invoice, you absorb the instance cost, and the status page becomes a visible reason the retainer earns its keep. This fits best when you already bill the client monthly.
Sell it as a standalone line. If a client has no retainer, price monitoring on its own at €20–40/month with the status page as the headline deliverable. State plainly what is monitored and how alerts reach them, so the line reads as a service rather than a mystery fee.
Charge a one-time setup fee. Pointing a status page at a client's domain, choosing which monitors show publicly, and wiring alert channels takes real time the first hour. A €50–150 setup fee covers that work and signals the service has substance. After setup, the monthly line runs close to passive.
A simple three-tier shape works well: a basic tier with core uptime checks and a status page; a plus tier that adds Beszel server health for clients with their own infrastructure; and a custom tier quoted as a project when a client wants Grafana dashboards. You are not inventing prices on the spot. You are mapping three named needs to three numbers.
What white-label actually requires
White-label monitoring means three things to a client: the status page lives on their domain, it carries their branding, and the bill comes from you. Uptime Kuma covers the first two cleanly. The third — branded invoices and billing pass-through — is on your side today, not ours.
A custom domain on the status page. Uptime Kuma can map a status page to a specific domain, so your client's customers see status.theircompany.com, not a generic host URL. DANIAN supports custom domains on the instance, so this works end to end.
Client branding on the page. Uptime Kuma status pages take a logo, a title, a theme, and your choice of which monitors to show publicly. The page a client shows their own customers reads as the client's page, not ours.
Billing pass-through. This is where the honesty matters. You pay DANIAN €9 per instance. You invoice your client whatever you charge — €15, €25, €40 — through your own billing. There is no built-in reseller invoicing or payment pass-through today, so the client relationship and the invoice stay with you. For most agencies that is the point: you keep the account.
What you do not get yet is a branded panel your client logs into to manage their own monitors. If a client needs that, set expectations before you sell it.
The DANIAN setup today — honestly, gaps included
Here is what reselling on DANIAN looks like right now, without the gloss. You deploy one isolated instance per client at €9/month, in the region you pick from 21 datacenter locations across six continents. We patch it, back it up, and monitor it. You point the status page at the client's domain. That part works today.
Each client's Uptime Kuma runs in its own hardened container, with its own resource allocation. Through the dashboard you get a per-container terminal and file manager, so if a client's instance needs a config tweak or a quick fix, your part-time sysadmin can do it without managing a whole server. We handle the patch cycle, the daily off-site backups, and 24/7 support from a named human when something needs us. You don't carry the on-call.
What is missing is worth naming. There is no single console to manage every client instance as a fleet — you manage them one at a time from the dashboard. There are no branded invoices or payment pass-through, so you bill clients yourself. There is a published partner commisions page for more info.
One promise that matters when you put your name on this: we won't upgrade a client's resources or bill for the change without your explicit say-so. If a card fails, we wait — we don't delete data.
Three layers of monitoring you can resell
Most clients only need the first layer. Knowing the next two lets you grow the account instead of capping it. Uptime Kuma covers “is it up?” Beszel covers “how is the server holding up?” Grafana covers “show me everything.” Each is open source, each runs on DANIAN at €9, and each suits a different client.
Uptime Kuma — the core line
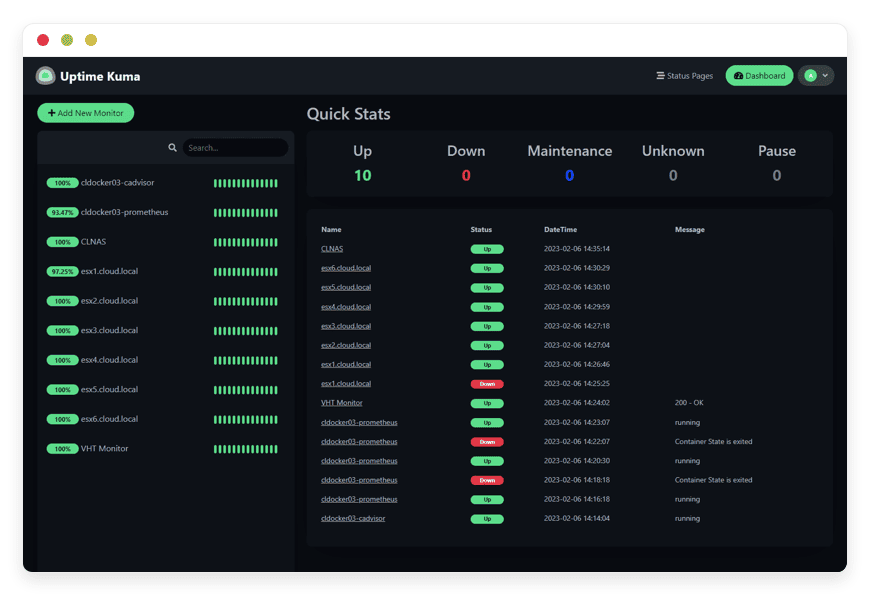
Uptime Kuma is the monitor most clients actually need. It checks HTTP, TCP, ping, keyword, JSON, DNS, port, and push endpoints, watches certificate expiry, and sends alerts through 90+ integrations including email, Slack, Telegram, and Discord. It is maintained by Louis Lam, has 87,000+ GitHub stars, and is MIT-licensed. Wholesale €9, retail €15–40.
Best for: any client with a website, store, or API that has to stay reachable.
Beszel — server and container health
When a client runs their own server or VM, Uptime Kuma tells you the site is down but not why. Beszel fills that gap. It tracks CPU, memory, disk, network, and Docker container stats with historical data and alerts, so you can catch “memory climbing 2% a day” before it crashes something. Beszel is built by henrygd, has 16,000+ stars, and is MIT-licensed.
Price it as a €10–25 add-on for clients with infrastructure to watch. You can add Beszel for server health as a second instance.
Grafana — the deep-dashboard tier
Grafana is where clients go when up/down checks aren't enough — custom metric dashboards, log views, and tracing, usually paired with Prometheus. It is more setup than a €9 line item, so quote it as a project plus a retainer, not a flat add-on.
Best for: technical clients who have outgrown a status page and want a real observability view. This is also the honest answer when a client asks Uptime Kuma to do something it doesn't.
When this works — and when it doesn't
Reselling managed monitoring fits some agencies cleanly and frustrates others. The deciding factor is what you need from day one. Three signals say go; three say wait. Read them honestly before you quote a client, because the gaps above are real and worth naming up front rather than after a contract.
It works when:
- You already manage client sites or infrastructure and own the relationship. Monitoring is a natural add-on, not a new business.
- You want a low-touch recurring line. Once an instance is set up, it runs with minutes of attention a month.
- Your clients value a status page they can show their own customers. The branded page on their domain is the visible deliverable.
It doesn't yet when:
- You need one console to manage 100 client instances as a fleet today. That console isn't shipped — you would manage them one at a time.
- You need branded invoices and payment pass-through out of the box. You would bill clients through your own system instead.
- Your clients need full APM — distributed tracing, log analytics, custom dashboards. That is Grafana-and-Prometheus work, not a €9 monitoring line.
FAQ
What is Uptime Kuma?
Uptime Kuma is an open-source, self-hosted monitoring tool maintained by Louis Lam. It runs HTTP, TCP, ping, keyword, DNS, port, and certificate checks, sends alerts through 90+ integrations, and publishes status pages. It is MIT-licensed with 87,000+ GitHub stars. On DANIAN it runs as a managed instance for €9/month.
Is Uptime Kuma free to use?
The Uptime Kuma software is free and open source under the MIT license, so there are no per-seat or license fees. What you pay DANIAN is €9/month per managed instance, which covers the server it runs on, security patching, daily off-site backups, monitoring, and 24/7 email and ticket support. You resell that managed service.
What can Uptime Kuma actually monitor?
HTTP, TCP, ping, keyword, JSON query, DNS, port, and push checks, plus certificate expiry, with alerts through 90+ services including email, Slack, Telegram, and Discord. It also publishes status pages. It does not do distributed tracing or log aggregation — for that a client needs Grafana with Prometheus, not Uptime Kuma.
Does Uptime Kuma monitor SSL certificate expiry?
Yes. Uptime Kuma watches TLS certificate expiry and alerts you a set number of days before a certificate lapses, so you can renew before a client’s site shows a browser warning. The same instance also runs HTTP, keyword, and port checks, so certificate monitoring sits alongside ordinary uptime checks at no extra cost.
Does Uptime Kuma check from multiple global locations like Pingdom?
Not by default. Uptime Kuma checks from wherever its instance runs, so it has no built-in global probe network the way Pingdom checks from many cities. You choose each instance’s region from 21 datacenter locations across six continents, and you can run more than one instance if a client needs checks from multiple regions.
What’s the difference between Uptime Kuma and Beszel?
Uptime Kuma answers whether a service is up from the outside — HTTP, port, keyword, and certificate checks, plus status pages. Beszel answers how the server itself is holding up from the inside — CPU, memory, disk, network, and Docker container stats. They complement each other; both run on DANIAN at €9, so you can resell either or both.
What if a client needs deeper monitoring than up or down?
Two paths. For server and container health — CPU, memory, disk, Docker stats — add Beszel as a second instance. For dashboards, metrics, logs, and tracing, move the client up to Grafana. Both run on DANIAN at €9, so you can layer monitoring as a client grows.
What does it cost me to resell Uptime Kuma?
One managed instance is €9/month per client at the base tier, which covers patching, daily off-site backups, monitoring, and 24/7 support. You set the retail price — most agencies charge €15–40/month. If you run several instances, see our Partner page.
What’s included in DANIAN’s €9/month managed Uptime Kuma plan?
Each managed instance includes 1 vCPU/RAM, 30 GB of storage, and 1,000 GB of monthly traffic, plus security patching, managed updates, daily off-site backups, monitoring, managed SMTP for alert emails, and 24/7 support from a named human. You also get a per-container terminal and file manager through the dashboard.
How much can an agency earn reselling uptime monitoring?
You pay €9/month per client instance and charge €15–40 retail, so each client yields €6–31 of gross margin monthly. At 10 clients that is €150–400 gross; at 25 clients, €375–1,000 gross against €225 of cost, leaving €150–775 net before your support time.
Can I resell uptime monitoring without managing my own server?
Yes. Each client’s Uptime Kuma runs as a managed instance in a hardened, isolated container, so you don’t run a VPS, patch an operating system, or carry on-call. DANIAN handles patching, updates, daily off-site backups, and monitoring. You need no sysadmin skills; you point the status page and set the price.
How many monitors can one Uptime Kuma instance handle?
Uptime Kuma is lightweight, so a baseline instance comfortably runs dozens of monitors; a common practitioner benchmark is around 50 checks at one-minute intervals on a small instance. If a client needs more, you can raise the instance’s resources through chat — the ceiling is 64 vCPU and 512 GB RAM.
How fast can I get a client’s monitor live?
Quickly. A managed Uptime Kuma instance deploys within minutes, and pointing a status page at your client’s domain and wiring alert channels usually takes the first hour. After that, DANIAN handles patching, updates, and backups, so the line runs with minutes of attention a month. You can often have a client live the same day.
How is this different from giving each client a Pingdom or UptimeRobot seat?
Those tools meter the number of checks and charge per seat for team features; Pingdom starts at $15/month for 10 checks, and UptimeRobot’s team tier adds $15/month per extra login seat. A managed Uptime Kuma instance is one flat €9, monitors as many endpoints as its resources allow, and keeps the client account with you.
Can I put the status page on my client’s own domain?
Yes. Uptime Kuma maps a status page to a specific domain, so your client’s customers see status.theircompany.com instead of a generic URL. You add the client’s logo, title, and theme, and choose which monitors appear publicly. The page reads as your client’s page, not ours.
Will my clients know I’m using DANIAN?
On the part clients see, no. The status page lives on your client’s domain with their logo, title, and theme, and you invoice them under your own brand, so the visible service reads as yours. There is no co-branded badge on the page; the relationship and the bill stay with you.
Can my clients log into their own monitoring dashboard?
Not today. Your client sees the public status page you publish on their domain, not a private login where they manage monitors themselves. You hold the admin dashboard and make changes for them, often in minutes. A client-facing panel is on the roadmap, not shipped, so set that expectation before you sell it.
Does DANIAN have a white-label reseller dashboard?
Not yet. Today you run one instance per client and manage them one at a time from the dashboard, and you bill clients through your own system. A central partner console with branded surfaces is on the roadmap, not shipped. So sell a monitored service with a branded status page, which works now.
What uptime can I promise my clients?
Quote conservatively. Real uptime depends on the application and the region you choose, so promise what the app can actually hold. DANIAN runs 24/7 monitoring, security patching, managed updates, and daily off-site backups on every instance. There is no published SLA percentage at the base tier — if a client needs a contractual guarantee, raise it with us first.
What happens to my client’s data if I stop paying?
If a card fails, we wait — we don’t delete data. That gives you room to fix billing without losing a client’s monitoring history. Because Uptime Kuma is open source, your configuration and data are portable: you can export and move them rather than being locked in. The client relationship stays yours throughout.
Where is my monitoring data hosted?
You choose the region for each instance from 21 datacenter locations across six continents, so a client’s monitoring data sits in the region you select for them. Different clients can run in different regions. Region changes go through chat rather than a self-serve button, so we can confirm before moving a running service.
What to do this week
Pick one client who already pays for a SaaS monitor. Deploy a managed Uptime Kuma instance, point a status page at their domain, and quote them a flat monthly rate inside their retainer. Watch it run for a month with almost no attention. If it sticks, add the next client.
For more info see our Partner page.