
Fully Managed Zabbix
as a Service
Deploy Zabbix as a fully managed service starting at €9/mo. Get automated backups, SSL, updates, support and monitoring included.
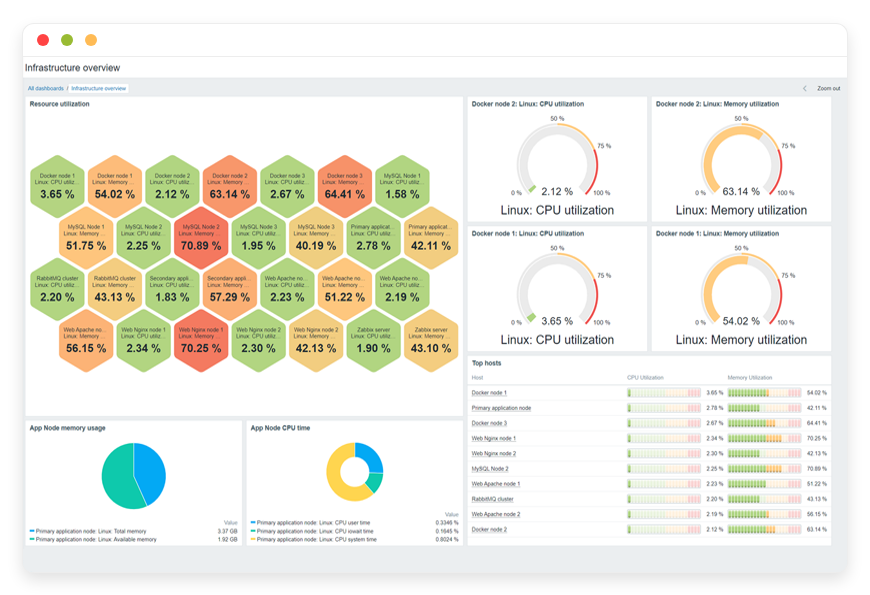
Zabbix is an open-source monitoring platform for servers, network gear, databases, cloud services and applications. It gives you the reach of a per-host tool like Datadog or PRTG without a licence meter attached to every machine you watch.
✓Free 7-day trial ✓99.9% Uptime SLA ✓No credit card ✓Cancel anytime
✓Free 7-day trial ✓99.9% Uptime SLA
✓No credit card ✓Cancel anytime

Zabbix
STARTING AT
USAGE
 Germany
 Finland
 Netherlands
 UK
 Sweden
 United States
 Canada
 Singapore
 Japan
 Australia
 Brazil
 South Africa+9 more →
ABOUT THE SOFTWARE
What is Zabbix
FEATURES
What Zabbix does
WHAT'S ALWAYS INCLUDED
Every app. Fully managed.
Nothing extra to pay for.
Every app you deploy includes the full managed service — security, backups, updates, and support from day one.
WHY MANAGED
Why teams pick managed Zabbix
REVIEWS
Hear from customers like you

No more maintenance headaches!
Finally, I can relax and not bother with maintenance. Each of the softwares that we run on DANIAN is automated and running stable for couple months already. They even assist us with modifying the DNS records. Once we needed to modify the config of Nextcloud so that we are able to upload higher than 5GB files and they assisted us fast. I also love their documentation!

Kevin Blackwell

Best managed service
I previously ran Peertube, Mastodon, Mattermost and Mirotalk on other providers before switching to DANIAN. I was tired of handling the updates and backups myself. Not only that the performance is "out of this world" fast, but their tech support is amazing. Since then I added 5-10 more Apps on my account. I also love how they add more softwares on their list constantly!

William Northfield

Love the personalized service!

George Adams
n8n runs excellent

David Hartmann

Smooth experience
I needed a way to manage the projects and files for my company. This was the first time I learn about opensource. I asked their support team and they assisted me immediately. I started with Openproject. Later I added Nextcloud. My team were able to get used to the apps fast.

Levi Nilsson

Bye GA

Wyatt Mitchell

Love the freedom
I wanted to use a crm for my startup. I signed up for the free trial. Tried out espocrm and dolibar and picked one. Their dashboard is very easy for a beginner. I recommend them and feel confident in choosing them.

Elias Koch
Wow just wow
After discovering DANIAN, I wished I'd found them sooner — their solution is excellent and deserves wider recognition. Very good solution!

Tyler Hollander
Professional tech support!

Bastian Engel
Their support team is the best!
I had a problem with my card and the subscription could not be renewed in time. I notified their support and surprisingly, they showed much understanding. They basically left my apps run until I solved the card issue. Other providers would have deleted my data in a heartbeat. This is the way to build client-vendor trust!
George Adams
Fair price and fast
4 months ago I activated n8n, Uptime kuma, Vaultwarden and Paperlessngx. So far everything is perfect. The performance of all apps is excellent. I contacted their support team couple times for using custom subdomains for the apps and they were fast and kind. I'm constantly recommending them to my network!

Atanas

Vaultwarden 10/10
I wanted to selfhost a passwords manager for my company but I didn't trust the mainstream providers. I tried out Vaultwarden for the free trial. I loved how their support team communicated with me professionally but still kind. I know that I can contact them whenever with whatever question I have. Recommended!

James Smith
Multiple locations options

Edward Nelson
Everything just works!
My focus is on my business, not running servers. I love that I can lauch any app without having to think about the tech behind it. Everything just works!

Tony Roy
Awesome support team!

Filip

Very proactive!
Today couple of the videos on my Peertube got viral. Before I even noticed, their support have notified me via email that they proactively upgraded my app with more cpu & ram so that it continues to work without any downtime. They left the upgraded app with the added resources for couple days until the traffic stabilizes. After that I had the possiblity to stay on the same plan or keep the upgraded plan. Out of gratitude I stayed on the upgraded one.

Luke Hall

Win-win!
I run a web design biz. After I perform the work for my clients, they constantly ask me for more software solutions. So I partnered with DANIAN. Not only I provide the requested softwares for my clients and get the increased revenue boost by delegating all to DANIAN, but also for those clients that wish to order directly from DANIAN, I send them an affiliate link. Win-win on all sides!

Luke Walker

Jeffrey Johnson
Awesome customer service
I needed to add analytics on my website but I didn't know anything about DNS. Their team guided me at all phases and they performed the changes for me. Additionally they were transparent and notified me of every change applied and steps performed.

Gabriele Marino

Good admin dashboard
Not only that I got Chatwoot, I also have access to the management dashboard. I love that I can view my hourly/daily usage and perform manual backups and restorations if needed. I don't need the level of control but it feels good to know that I have it if I need it.

Matthew Turner

Andreas Schmitt
Great service!
I configure custom Matomo tracking for my clients as a monthly service. Many of my clients were asking if they can selfhost Matomo instead of using the Cloud service. My employee recommended DANIAN. Basically, I can activate as much Matomo's in any of 20+ countries the same day. Additionally the affiliate revenue is a nice bonus.

Jacob Turner
Smooth experience
I was listing through youtube tuts on how to install Bookstack myself. Then randomly, I found their video playlist exactly for Bookstack. Got curious and went at their website. For the same price (or higher) that I would pay for just the VPS, with them I'm getting a fully managed Bookstack. It's a no-brainer decision!

Elias Gustafsson


Mason Hayes
Its a great service
Its a great service. I love the performance of my Mastodon community. It keeps on growing and I don't have any worries about backups, secuirity, updates, etc.

Vinícius Rocha

Very intuitive solution!
I wanted to use a nocode software for my company. A friend recommended them so I tried both Baserow and NocoDB, couple days later picked one.

Haruto Hashimoto


Henrik Otto
USE CASES
Three teams who run Zabbix on DANIAN
Zabbix earns its keep where the estate is bigger than the team watching it. These are the shapes of team that put a managed monitoring server to work rather than adding another machine to maintain.
14-PERSON MANAGED SERVICE PROVIDER
Replacing a per-device monitoring add-on across six customer networks
One managed instance, one Zabbix proxy inside each customer network. Proxies hold data locally when a customer link drops and flush it on reconnect. Host groups and user permissions keep each customer to their own view, and a scheduled report goes out monthly per account.
REGIONAL WIRELESS INTERNET PROVIDER
Watching 40 tower sites without a monitoring box at every site
SNMP polling of radios, switches and power distribution at each tower, aggregated through a proxy per aggregation point. Interface saturation and battery voltage carry separate severities, and trigger dependencies stop one dark tower from generating forty alerts.
30-PERSON SOFTWARE COMPANY
Leaving a per-host bill that crossed four figures at 60 machines
Agents run in active mode and connect outward, so no inbound rules were opened in the production network. Application checks come from user parameters already written for the old tool, and log monitoring covers the four services that page the on-call engineer.
COMPARISON
Four ways to run Zabbix
The cost of monitoring is rarely the software. It is the licence meter on the tool, or the hours you spend keeping a free tool healthy. Here is what the four realistic options cost for the same handful of monitored machines.
| Path | 1 monitored host | 5 hosts | 10 hosts | Who does the work |
|---|---|---|---|---|
| Proprietary SaaS (per-host) | $15/mo | $75/mo | $150/mo | Nothing to run. Cost rises with every machine you add, and metric and log volume are metered separately. |
| Self-host on a VPS | $24/mo | $24/mo | $24/mo | Yours: partitioning, retention, cache sizing, schema upgrades, backups and the disk-fill alert. Budget a few hours a month once it is real. |
| Home server | ~$260 once | ~$260 once | ~$260 once | Same operational work, plus your own power, internet link and hardware failures. A mini PC with 16 GB of RAM and an NVMe drive is the usual starting point. |
| DANIAN managed hosting for Zabbix | €9/mo | €9/mo | €9/mo | Ours: database tuning, retention design, updates, backups and the disk headroom. Yours: the trigger rules and who gets paged. |
The per-host column is Datadog infrastructure pricing at list, billed annually; verify current figures before you decide. Our price does not move with monitored host count. What does move is the resources the instance needs, and those are upgradeable inside the same €9 plan structure.
BY INDUSTRY
Zabbix for specific industries
Monitoring requirements differ more by sector than most software does. A plant floor, a carrier network and a service provider have different rules about what must be recorded, how long it is kept, and who is allowed to see it.
FAQ
Frequently asked questions
Everything teams ask before signing up — answered straight, without sales speak.
Three groups: technical setup, migration, and how DANIAN works as a service.
01
Technical and configuration
02
Migration and onboarding
03
Billing, support, and platform
DEPLOY IN YOUR REGION
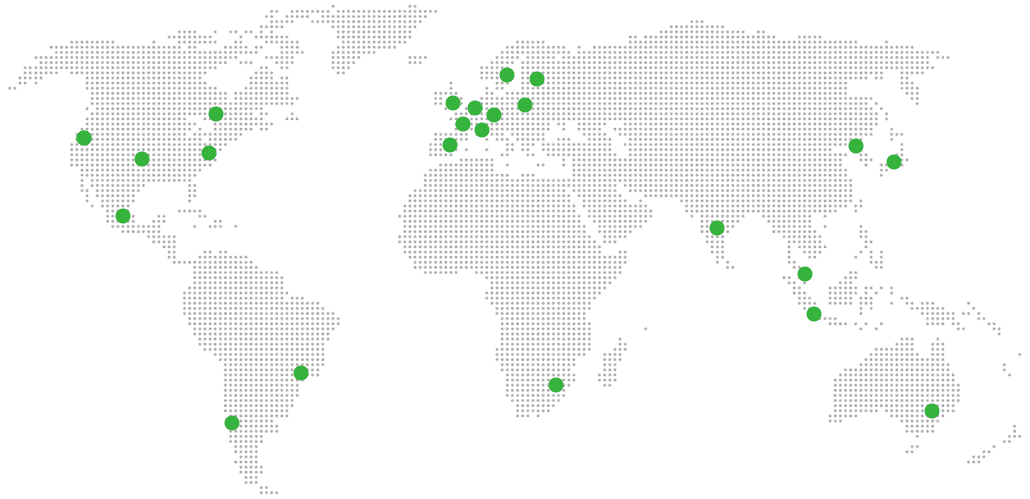
21 datacenter locations on six continents
Pick the region closest to your users.
United States, Germany, Finland, Singapore, Australia, Brazil, Canada, Netherlands, UK, Spain, Italy, France, Sweden, Malaysia, India, Japan, Mexico, Poland, South Korea, Chile, South Africa and more coming soon
Try managed Zabbix for 7 days
SERVICES
COMPANY
RESOURCES
COMPARE


