Open-source alternatives to Tableau and Looker in 2026
Open-source alternatives to Tableau and Looker in 2026 — Metabase, Superset, and Redash for BI you own
TL;DR
- Tableau Creator lists at $75 per user per month, billed annually, and every Tableau deployment needs at least one. Looker's enterprise platform starts near $60,000 per year before seats. Both bills grow with headcount.
- Three open-source tools cover most of what small teams use Tableau and Looker for: Metabase (the visual question builder), Apache Superset (the powerful, chart-rich platform), and Redash (the SQL-first query-and-dashboard tool).
- Self-hosted BI has no per-seat fee. One instance serves your whole team. The cost moves from per-user licensing to hosting plus operations.
- Run any of the three as a managed app on DANIAN for €9 per month, flat — patching, backups, monitoring, and 24/7 support included. Your dashboards and your instance stay yours.
- Honest take: Tableau's polish and Looker's LookML governance layer are real edges. For common dashboards on your own database, the open-source tools close most of the gap at a fraction of the per-seat cost.
Why teams are leaving Tableau and Looker in 2026
The trigger is usually a renewal email or a fresh quote. Tableau Creator seats list at $75 per user per month; Looker's platform floor sits near $60,000 per year before per-user fees. Per-seat pricing climbs faster than a small team grows. At some point the math stops fitting the budget, and someone is asked to find another way.
Tableau's published pricing on the Standard edition runs $15 per user a month for a Viewer, $42 for an Explorer, and $75 for a Creator, all billed annually. The Enterprise edition is higher: $35, $70, and $115. Every deployment needs at least one Creator. So five people who all build dashboards pay 5 × $75 = $375 a month, or $4,500 a year. Ten builders cost $750 a month — $9,000 a year — before training or warehouse compute.
There's a quieter cost too. People who only read dashboards still need a paid Viewer seat. As the audience grows, the seat count grows with it, whether or not those people ever build anything. The bill tracks your org chart, not your usage.
Looker is a different shape. It is Google Cloud's enterprise BI platform, built around LookML — a modeling language that defines metrics in one central place. Pricing is quote-based and not published, but reported entry points cluster near a $60,000-per-year platform floor, plus per-user seats and the warehouse query costs that ride along. This is the LookML platform, not the lightweight Looker Studio, which Google renamed back to Data Studio in 2026.
The annual commitment is its own friction. Tableau's lower public prices assume you pay a year upfront; the monthly option costs more. Seats are easy to add mid-term and awkward to remove until renewal. So the bill ratchets up with hiring and rarely down. That is the opposite of how a small team's needs actually move through a year.
None of this means the tools are bad. Tableau is a mature visualization product. Looker's model keeps metric definitions consistent across a large organization. The friction is that the pricing model meets a small team at the wrong angle. You pay by the head, the commitment is annual, and a five-person analytics function ends up funding an enterprise price card. That is the moment teams ask whether they can own the tool instead of renting a seat inside it.
What “alternative” actually means here
“Alternative” splits three ways. You can move to a cheaper proprietary tool and stay on per-seat pricing. You can self-host an open-source tool and trade licensing for your own operations time. Or you can run that open-source tool as a managed service and pay a flat hosting price instead of per-seat fees. The three paths suit different teams.
Path one is a cheaper proprietary SaaS. Several exist, and some are good. The catch is structural: you are still renting seats, still exposed to the next price change, still billed by headcount. You have swapped the logo, not the model.
Path two is self-hosting the open-source tool yourself. The software license is free. You provide the rest: a server — a production-class VPS runs about $24 a month — plus a metadata database, TLS certificates, backups, security updates, monitoring, and the time to keep all of it current. For a team with an engineer who enjoys this work, that is a fair choice. For a team without one, the licensing money you saved gets spent on operations time instead. And a BI tool that sits unpatched on the public internet is a liability, not a saving.
Path three is running the open-source tool as a managed service. Someone else operates the server, applies the patches, runs the backups, and answers when something breaks. You keep a flat, predictable cost and skip the operations. This is the path we run at DANIAN: €9 per app per month, the same floor across the whole catalog. The projects themselves also offer first-party clouds — Metabase Cloud, and Preset for Superset — which are worth knowing about. What differs with us is one flat price across any of 150-plus apps and hands-on support on every plan, so your BI tool sits next to the rest of your stack under one bill.
One fact makes all three viable: open-source BI tools connect to the database you already run and query it where it lives. You are not migrating your data. You are changing the tool that reads it. Your Postgres, MySQL, BigQuery, or warehouse stays put; the BI tool points at it. That keeps the switch small and reversible.
Ownership is the quieter benefit. The dashboards you build, the queries you save, and the instance they run on are yours. You can export them, move them, or back them up on your own terms. No vendor can change the price, retire the plan, or move a feature you rely on into a higher tier next quarter. The tool answers to you, not to a roadmap you do not control.
The shortlist — three open-source tools worth deploying
Three open-source tools cover the BI ground that most small and mid-sized teams actually walk: Metabase, Apache Superset, and Redash. They differ mainly in who is meant to build the dashboards, how much visualization depth you need, and how much setup you are willing to do. Here is where each one fits.
Metabase — the fastest path to a first dashboard
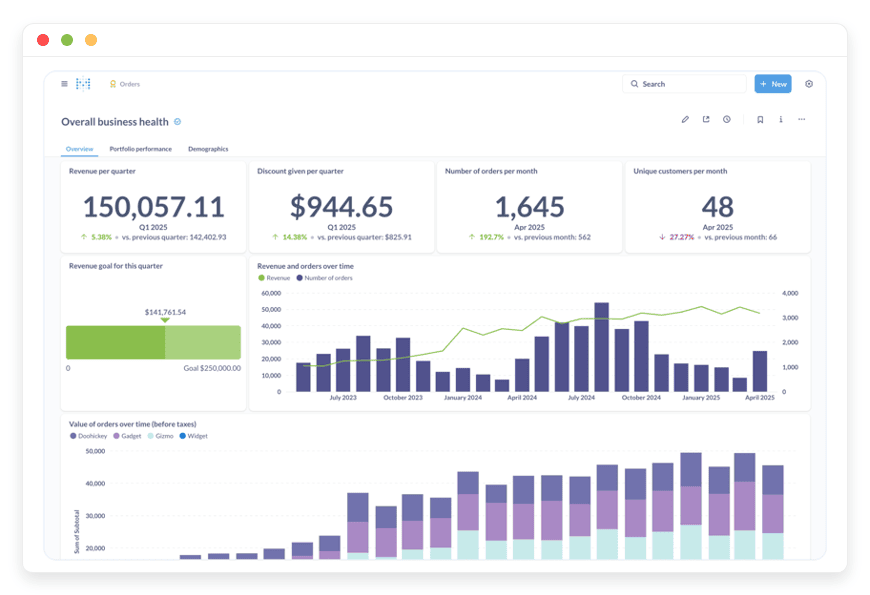
Metabase is the easy one. Its visual “question” builder lets someone who doesn't write SQL pull data, filter it, and chart it from a clean interface. It connects to your existing database in minutes and turns raw tables into shareable dashboards. Best for teams where non-analysts need to self-serve.
It is built by Metabase, Inc. and released under the AGPL-3.0 license, with around 47,000 GitHub stars. Reach for it when the people asking questions of the data are not the people who know SQL. One honest caveat: embedding Metabase inside a customer-facing product triggers commercial-license terms under the AGPL; for internal dashboards, the open-source edition is free of that consideration. On DANIAN, managed Metabase hosting runs €9 per month.
Day to day, Metabase leans on a few features that make it stick. Its X-ray view auto-generates a starter dashboard from any table. Saved questions become reusable building blocks for other charts. Scheduled reports land in email or chat on a cadence you set. The honest limit is depth: for very complex joins or heavy custom SQL, a SQL-first tool feels more direct.
Apache Superset — the powerful one
Apache Superset is the heavyweight. It offers the widest range of chart types, a strong SQL editor in SQL Lab, role-based access, row-level security, and the ability to query large warehouses. It rewards teams with the appetite to configure it. Best for analysts and data teams that want depth and scale.
Superset began as an Airbnb hack-a-thon project from Maxime Beauchemin — who also created Apache Airflow — and is now a top-level Apache Software Foundation project under the permissive Apache 2.0 license, with around 73,000 GitHub stars. Apache 2.0 means no embedding restriction to weigh. The honest trade-off is setup and operations: Superset has more moving parts than Metabase, and a self-hosted instance asks for real platform-engineering attention. That is exactly the work a managed deployment removes. On DANIAN, managed Apache Superset runs €9 per month.
In use, Superset shows its range. SQL Lab is a full query workbench with history and saved queries. The chart library spans dozens of types, from basic bars to geospatial and time-series. Dashboards support cross-filters and drill-downs. The cost of that range is configuration: caching, async queries, and security all reward someone who reads the docs. A managed deployment carries that operational weight for you.
Redash — SQL-first, built for analysts
Redash is the query-led option. You write SQL against any of 35-plus data sources, save the queries, turn them into visualizations, and arrange them on dashboards. It is lean and direct, with a schema browser and autocomplete. Best for analysts who think in SQL and want a fast query-to-dashboard loop.
Redash is released under the permissive BSD-2-Clause license and has roughly 28,000 GitHub stars. Worth knowing honestly: the original hosted Redash service was discontinued, and the project now runs as a community-led effort with volunteer maintainers. Development moves slower than Metabase's or Superset's, so it suits teams comfortable running a more hands-on tool — or one that is operated for them. The query-and-share workflow is still excellent for SQL analysts. On DANIAN, Redash for SQL-first dashboards runs €9 per month.
The Redash loop is simple and fast. Write a query, see results, turn them into a chart, drop it on a dashboard. Query parameters let viewers filter without touching SQL. Results cache and refresh on a schedule you choose. It suits an analyst who would rather write SQL than click through a builder. Weigh the slower release pace before you commit a critical workflow to it.
The numbers side by side
The contrast is stark once you put it on one line. Ten Tableau Creator seats list at $9,000 a year. Looker's platform starts near $60,000 a year before seats. One managed open-source instance on DANIAN is €9 a month — €108 a year — and serves your whole team, with no per-seat fee at all.
The per-seat math at the scale most small teams hit:
| Builders / seats | Tableau Creator (Standard, list, annual) | DANIAN managed BI |
|---|---|---|
| 1 seat | $75 / mo · $900 / yr | €9 / mo · €108 / yr |
| 5 seats | $375 / mo · $4,500 / yr | €9 / mo · €108 / yr |
| 10 seats | $750 / mo · $9,000 / yr | €9 / mo · €108 / yr |
Tableau figures are list prices for the Creator role on Tableau Cloud Standard, billed annually; viewers and explorers cost extra and add up as the audience grows. The DANIAN figure is one instance at the base tier. Very heavy concurrent use may need a resource upgrade, which we apply only after you approve it.
Stretch the comparison over three years and the gap widens. Ten Tableau Creator seats run about $27,000 across that span; one managed instance runs roughly €324. Price in a few hours of your own setup time and the order of magnitude does not move. The flat line stays flat while the per-seat line climbs with every hire.
And the three tools at a glance:
| Tool | Replaces(Tableau @ 10 Creator seats) | DANIAN price | GitHub stars | Host region | Switching effort |
|---|---|---|---|---|---|
| Metabase | ~$9,000 / yr | €9 / mo | ~47,000 | Region of your choice | Low — visual builder, connect a database |
| Apache Superset | ~$9,000 / yr | €9 / mo | ~73,000 | Region of your choice | Medium — more setup, more power |
| Redash | ~$9,000 / yr | €9 / mo | ~28,000 | Region of your choice | Low–medium — SQL-first, rebuild queries |
GitHub stars and versions verified in 2026. Licenses: AGPL-3.0 (Metabase), Apache 2.0 (Superset), BSD-2-Clause (Redash). “Region of your choice” means you pick from 21 datacenter locations across six continents at deploy time.
What switching actually looks like
The switch is smaller than the price gap suggests. You stand up one instance, connect it to the database you already run, and rebuild your active dashboards against the same tables. Most of the work is recreating the views that matter, not moving data. A focused week covers a typical small-team setup.
Start with the connection. Each tool asks for your database host, port, and read credentials, then reads the schema. Within an hour you are querying live data. Point it at a read replica if you have one, so reporting load never touches your primary database.
You are not stuck extracting anything from Tableau itself. Because these tools query your source database directly, you rebuild from the same tables Tableau read from. There is no workbook to export and no internal format to untangle. The source of truth was always your database. You are pointing a new, cheaper reader at it.
Then rebuild in order of use. List the dashboards your team actually opens — usually far fewer than the full library suggests. Recreate the top handful first. In Metabase you rebuild them in the question builder; in Redash or Superset you port the underlying SQL. The reports nobody opens can wait, or quietly retire.
Set access and sharing last. All three handle users, groups, and per-dashboard permissions. Add your team, decide who sees what, and wire up scheduled email or chat delivery for people who like reports in their inbox. At that point the new tool does what the old one did, on infrastructure you control.
Two things genuinely take effort. Pixel-exact dashboard layouts and any bespoke Tableau calculated fields need rebuilding by hand. And if you relied on Looker's central LookML metric definitions, you recreate that logic in your queries or a modeling layer. Budget time for both, and the rest moves quickly.
How to pick — three questions to ask yourself
Three questions settle most of the decision. Who builds the dashboards, and how comfortable are they with SQL? How much visualization power and scale do you actually need? And who is going to keep the tool running? The last one decides self-host versus managed more than anything else does.
- How technical is the team that builds dashboards? If the people asking questions don't write SQL, Metabase's visual builder is the shortest path. If they are SQL-fluent analysts who live in a query editor, Redash or Superset will feel more natural and faster day to day.
- How much power and scale do you need? For straightforward dashboards on a database, Metabase or Redash do the job without ceremony. For a wide chart library, row-level security, and querying a large warehouse, Superset has the most depth — at the cost of more setup and more to operate.
- Who keeps it running? This is the real fork. If you have an engineer who enjoys patching, backups, and upgrades, self-hosting on a VPS is a reasonable choice. If nobody owns that work — and on a small team, nobody usually does — a managed instance turns the whole operational question into a €9 line item. That is the gap we fill.
FAQ
These are the questions teams ask most when they weigh open-source BI against Tableau or Looker — on which tool to pick, what it costs, what it connects to, and how the switch actually works. Each answer is short and self-contained, so you can scan to the one you need.
What is the best open-source alternative to Tableau?
There is no single winner — it depends on your team. Metabase is the easiest, and best for non-technical users who need self-serve dashboards. Apache Superset offers the most chart types and the most scale. Redash suits SQL-first analysts. All three connect to your existing database and run €9 a month managed on DANIAN.
What is the best open-source alternative to Looker?
Apache Superset comes closest. It scales to large warehouses, offers role-based access, and supports a semantic layer for shared metrics. The honest gap is Looker's LookML, a modeling language for centrally defined metrics; you recreate that logic in queries or a modeling layer. Superset runs €9 a month managed on DANIAN.
Which one should a non-technical team start with?
Metabase. Its question builder lets someone who doesn't write SQL connect a database, filter data, and build a dashboard from a clean interface. It is the fastest of the three to a first useful chart, which matters most when the people using it are not analysts by trade.
Metabase vs Superset: which should I choose?
Choose Metabase if speed and simplicity matter most; its visual builder lets non-analysts build dashboards in minutes. Choose Apache Superset if you need the widest chart library, row-level security, and the power to query large warehouses. Metabase is easier to run; Superset is more capable but asks for more setup. Both are €9 a month managed.
Metabase vs Redash: what's the difference?
The difference is how you build. Metabase offers a visual question builder, so people who don't write SQL can pull and chart data. Redash is SQL-first: you write queries against 35-plus data sources, then turn them into dashboards. Metabase suits mixed teams; Redash suits analysts who live in SQL. Both run €9 a month managed.
Is open-source BI actually free?
The software license is free for all three tools. Running it is not: self-hosting costs you a server, a metadata database, backups, and the time to maintain them. The flat alternative is managed hosting — €9 a month on DANIAN — with no per-seat licensing on top, whatever the tool.
Is Metabase cheaper than Tableau?
For a team, yes — by a wide margin. Tableau charges per user: a Creator seat lists at $75 a month, so ten builders cost $9,000 a year. Metabase has no per-seat fee; one instance serves everyone. Managed on DANIAN it is €9 a month flat, about €108 a year for the whole team.
What's the cheapest way to replace Tableau?
Run an open-source tool — Metabase, Superset, or Redash — instead of paying per seat. Self-hosting costs only a server, roughly $24 a month for a production-class VPS, plus your own maintenance time. Managed hosting removes that work for a flat €9 a month, with no per-user licensing on top, whatever your team size.
Do I have to move my data?
No. Metabase, Superset, and Redash connect to the database you already run and query it where it lives. Your Postgres, MySQL, BigQuery, or warehouse stays put. You are changing the tool that reads the data, not migrating the data itself — which keeps the switch small and low-risk.
Which databases do Metabase, Superset, and Redash connect to?
All the common ones. Expect PostgreSQL, MySQL, SQL Server, BigQuery, Snowflake, Redshift, and many more. Redash alone supports 35-plus data sources. Each tool connects to the database you already run and queries it where it lives, so you point the tool at your data rather than moving it.
How hard is it to migrate from Tableau to one of these tools?
Less work than the cost gap suggests. You connect the new tool to the same database Tableau read from, then rebuild your most-used dashboards — usually a small number. A typical small-team switch takes about a week. The effort is recreating views, not moving data; bespoke calculated fields take the most time.
Can I embed these dashboards in my own product?
Yes, with one license note. Apache Superset (Apache 2.0) and Redash (BSD) carry permissive licenses, so embedding in a commercial product is straightforward. Metabase is AGPL-3.0: embedding inside a customer-facing product triggers commercial-license terms, though internal dashboards are unaffected. Pick the license that matches how you plan to use it.
Do these tools support scheduled reports and alerts?
Yes. All three can deliver dashboards and query results on a schedule, by email or chat, so people get reports without logging in. Metabase and Redash also support alerts that fire when a value crosses a threshold you set. You choose the cadence and the recipients for each report.
Do open-source BI tools support row-level security and access control?
Yes, with differences. All three manage users, groups, and per-dashboard permissions. Apache Superset's open-source edition includes row-level security, which filters one dashboard by who is viewing it. In Metabase, that row-level data sandboxing sits in a paid tier. You still control access centrally, without a seat for every viewer.
Can these tools handle large data warehouses?
Yes, especially Apache Superset. It is built to query large warehouses like BigQuery, Snowflake, and Redshift, with caching and async queries for heavy workloads. Metabase and Redash also connect to warehouses and work well for most reporting. For the largest, most concurrent workloads, Superset has the most headroom.
How many people can use one instance?
As many as your team needs — self-hosted BI has no per-seat licensing. One instance serves everyone at the flat hosting price. Very heavy concurrent usage can call for more CPU or memory, which on DANIAN we add only after you approve it. No silent overage, no per-head bill.
Do I need a data engineer to run open-source BI?
Only if you self-host. Running your own instance means handling a server, updates, backups, and monitoring — work that suits a team with an engineer who enjoys it. If nobody owns that, managed hosting removes it: we run the server and apply the patches, and you use the tool for €9 a month.
Is self-hosted business intelligence secure?
It is as secure as you keep it. A self-hosted instance needs regular security updates, TLS, and backups; an unpatched tool exposed to the internet is a real risk. Managed hosting handles patching, isolation, and backups for you, so the tool stays current without that maintenance falling on your team.
Will I lose Tableau's polish or Looker's governance?
Honestly, you give up some of each. Tableau's visual finish and Looker's LookML layer for centrally defined metrics are real strengths. For most dashboards built on your own database, the open-source tools cover the need. If centralized metric definitions or top-tier visual polish is your deciding factor, weigh that before switching.
What's included in managed open-source BI hosting?
On DANIAN, €9 a month covers the server, security patching, automated backups, monitoring, and 24/7 email and ticket support — one flat price across any of 150-plus apps. You get the open-source tool, fully operated, on infrastructure you can leave at any time. We will not upgrade your resources or charge you without your explicit consent.
Can I host it in a specific region?
Yes. You pick the region when you deploy, from 21 datacenter locations across six continents — including an EU region if your data needs to stay in a particular jurisdiction. Choosing the region closest to your users also keeps dashboards responsive. The choice is yours, per app.
What to do this week
Pick the tool that matches how your team works. Deploy one instance, point it at your existing database, and rebuild your three most-used dashboards. Give it a week of real use. If it covers what you need, you have replaced a per-seat bill with a flat one.
Match the tool to the team. Non-technical users who need self-serve dashboards: start with Metabase. SQL-fluent analysts who want a fast query-to-chart loop: Redash. A data team that wants depth, scale, and the widest chart library: Apache Superset.
Then deploy it where it is least painful. Self-hosting is sound if you have someone who owns the operations and enjoys it. If you don't, the managed path removes the server, the patching, the backups, and the on-call: €9 per app per month, the same across the catalog, with a 7-day free trial and no card required. We will not upgrade your resources or charge you without your explicit consent. Card failed? We wait. We don't delete your data.
One more practical note: you do not have to commit on day one. Run the trial, rebuild a dashboard or two, and let the team react to the real thing. If it falls short, you have spent a week and learned what you actually need. If it holds, you cancel the per-seat contract at its next renewal and keep the flat bill from there.
The per-seat math is what brought you here. The flat math — €108 a year for an instance your whole team can use — is the reason to make the move.
Sources
- Tableau pricing (Creator, Explorer, Viewer): tableau.com/pricing
- Looker (enterprise BI platform) on Google Cloud: cloud.google.com/looker
- Metabase project and source: metabase.com · github.com/metabase/metabase
- Apache Superset project: superset.apache.org
- Redash project and source: redash.io · github.com/getredash/redash