Powerful Time-Series Monitoring with Managed Prometheus Hosting
TLDR - Quick Answer
Prometheus is an open-source systems monitoring and alerting toolkit.
It records real-time metrics in a highly efficient time-series database.
Managed Prometheus Hosting provides this powerful visibility without server maintenance.
You get instant access to PromQL querying without configuring Linux services.
Alerts work immediately to catch application errors before your users do.
Introduction
Software runs the modern world. Your applications generate thousands of events every single second. You need to know when server memory spikes. You need to know when database queries slow down. Catching these errors early prevents expensive downtime. You cannot fix what you cannot measure.
Prometheus tracks these metrics perfectly. It provides absolute visibility into your software health. But running it yourself is a second job. You have to configure storage partitions. You have to manage system updates. You have to constantly monitor the monitoring tool itself. This wastes valuable engineering hours. You want to build features, not manage infrastructure.
DANIAN acts as your invisible infrastructure. We handle the technical maintenance so you can focus entirely on building great applications. We maintain the servers. We manage the backups. We keep the software updated. You just write the queries and view the dashboards.
What is Prometheus?
Prometheus is a powerful open-source systems monitoring and alerting toolkit. It was originally built by engineers at SoundCloud in 2012. Since then, it has become the standard for modern system monitoring. The project is highly active and supported by a massive community of developers. It is completely open-source under the Apache 2.0 license.
The core function of Prometheus is simple but incredibly powerful. It scrapes metrics from your applications. It stores these metrics locally in a custom time-series database. It then allows you to query, graph, and build alerts based on that raw data. Every single piece of data is stored with a specific timestamp. This allows you to look back in time. You can see exactly how your systems performed during peak traffic.
Why is it trending?
Prometheus is trending because it is incredibly reliable. It uses an independent, single-node architecture. It does not rely on complex network storage. When the rest of your network fails, Prometheus keeps running. This is exactly what you want from a monitoring system. You need it to survive the outage. It must stay alive to tell you what caused the outage in the first place. This reliability makes it the ultimate truth source for technical teams.
Why Choose Prometheus?
Proprietary monitoring tools are expensive. They charge you per host. They charge you per custom metric. As your application grows, your monitoring bill grows even faster. You are punished financially for tracking more data. This forces engineers to monitor less. That is a dangerous practice.
Hosting Prometheus solves this exact problem. You get complete open-source freedom. You control the software entirely. You avoid massive monthly bills from proprietary vendors. You can track millions of metrics without worrying about hitting an arbitrary paywall. Your monitoring strategy is dictated by engineering needs, not budget constraints.
When you choose Managed Prometheus Hosting, you get the absolute best of both worlds. You get the financial predictability of open-source software. You also get the reliability of a professional technical team. We manage the servers behind the scenes. You simply log in and analyze your performance data.
Key Features of Prometheus
Prometheus is built for immense scale and perfect reliability. It includes several technical innovations that make it superior to traditional monitoring systems. These features change how engineering teams approach software visibility.
Multi-Dimensional Data Model
Prometheus does not just store flat metrics. It uses a multi-dimensional data model. Every time-series is identified by a metric name and a set of key-value pairs. These pairs are called labels. For example, instead of just tracking total HTTP requests, you can track http_requests_total{status="200", method="GET"}. This allows you to filter and group data with extreme precision. You can see exactly how many POST requests resulted in a 500 error on a specific server. Labels make your data highly searchable.
PromQL (Prometheus Query Language)
PromQL is the built-in query language. It is incredibly flexible and built specifically for time-series data. You can slice and dice metrics in real-time. You can calculate the rate of errors over a rolling five-minute window using the rate() function. You can predict when a hard drive will fill up based on the current growth rate. You can calculate the 99th percentile of response times using histogram_quantile(). PromQL is read-only. This makes it safe to use for generating dashboards and temporary ad-hoc queries.
Pull-Based Metric Collection
Most legacy monitoring tools require you to push data to a central server. Prometheus does the opposite. It pulls data via HTTP. Your applications simply expose a /metrics endpoint. Prometheus visits that endpoint at regular intervals. It scrapes the text-based data and stores it. This decentralized approach creates much less overhead on your client applications. It also tells you immediately if a target is down. If the HTTP scrape fails, Prometheus knows the application is offline.
Autonomous Single-Node Storage
Prometheus stores data on local disks. It uses a highly optimized Time-Series Database (TSDB). It does not require a complex database cluster to function. It compresses data efficiently to save disk space. This makes it incredibly easy to start and highly resilient. During a massive system failure, Prometheus remains fully operational. You do not need to fix your database cluster just to read your monitoring alerts.
Four Distinct Metric Types
Prometheus client libraries offer four core metric types for instrumentation.
Counters track numbers that only go up. Website visits and total errors are counters.
Gauges track numbers that go up and down. Current memory usage and active user sessions are gauges.
Histograms track the frequency and size of events. They group API response times into specific latency buckets.
Summaries provide accurate quantiles for specific events. They calculate these percentiles directly on the client side.
This variety gives you the exact mathematical tool you need for any specific measurement.
Built-In Alertmanager
Prometheus strictly separates alerting rules from alert notifications. The main server evaluates your math rules. When a rule triggers, it sends an alert event to the Alertmanager component. Alertmanager handles the human side of the process. It groups similar alerts together. If ten servers crash, it sends one combined message instead of ten separate emails. It routes these alerts to Slack, email, or PagerDuty. It also allows you to silence known issues. This prevents severe alert fatigue among your engineering team.
Dynamic Service Discovery
Modern infrastructure changes constantly. Virtual machines spin up and shut down automatically based on traffic. You cannot manually update a list of IP addresses every time a server boots. Prometheus solves this with Service Discovery. It integrates directly with infrastructure APIs. It asks the API for a list of currently active servers. It then automatically begins scraping those new targets. When a server shuts down, Prometheus stops scraping it. This keeps your monitoring perfectly synchronized with your real-world infrastructure.
The Pushgateway for Ephemeral Jobs
Prometheus is a pull-based system. But some tasks do not live long enough to be pulled. A database backup script might run for only three seconds. Prometheus might only scrape every fifteen seconds. The script would finish and disappear before Prometheus ever saw it. The Pushgateway solves this. The short-lived script pushes its final metrics to the Pushgateway. The Pushgateway holds onto those metrics. Prometheus then scrapes the Pushgateway at its normal interval. You never lose visibility into your automated tasks.
Extensive Exporter Ecosystem
You do not need to rewrite your entire software stack to use Prometheus. The community provides hundreds of "exporters." These are small bridge programs. They pull metrics from existing software and translate them into the Prometheus format. You can use the Node Exporter to monitor Linux servers. You can use the MySQL Exporter to track database locks. You can use the Blackbox Exporter to ping external website URLs. You can achieve total system visibility in minutes without modifying third-party code.
Native Federation for Massive Scale
Sometimes a single Prometheus server is not enough. You might have thousands of servers spread across different continents. Prometheus supports Federation. This allows one Prometheus server to scrape selected data from another Prometheus server. You can run a small Prometheus server in each physical location. These local servers scrape detailed metrics. Then, a central, global Prometheus server scrapes aggregate data from the local servers. This hierarchical tree allows you to monitor massive, global networks efficiently.
Solutions per Industry
Different businesses face completely different technical challenges. Prometheus is versatile enough to monitor any environment. We have seen it transform operations across countless distinct industries.
eCommerce Stores
Online retail relies entirely on speed and uptime. Black Friday traffic spikes can crash a web store in seconds. Every single minute of downtime costs thousands of dollars in lost revenue. An eCommerce team can use Prometheus to monitor the exact latency of their checkout API. They can track cart abandonment errors in real-time. If the payment gateway integration slows down by just two seconds, Prometheus detects the anomaly. It alerts the team immediately. Engineers can reroute traffic or scale resources before customers even notice the delay.
Digital Agencies
Agencies often manage dozens of websites for many different clients. They need to ensure every single site remains fast and reliable. A digital agency can use Prometheus to track resource usage across all client servers simultaneously. They can monitor memory consumption per PHP process. They can set up intelligent alerts. These alerts notify them if a specific client's website experiences a sudden spike in 404 errors. This allows the agency to provide proactive support. They fix the broken links before the client ever complains.
Education and EdTech
Universities and online learning platforms face massive, predictable traffic spikes. Registration day brings thousands of students to the portal at the exact same moment. An education IT team can use Prometheus to monitor database connection pools. They can track active student sessions on the learning management system. If the login server starts queuing requests, Prometheus shows exactly where the bottleneck is happening. The IT team can provision more servers instantly, ensuring a smooth enrollment process for every student.
Software Development (SaaS)
Software companies push new code to production daily. They need to know if a new release introduces performance regressions. A SaaS team can instrument their code directly with official Prometheus client libraries. They can monitor the exact duration of complex database queries. They can correlate their code deployment timestamps with CPU usage spikes. If a new feature causes the application to consume double the memory, Prometheus highlights the issue instantly. The team can roll back the release immediately to protect the user experience.
Financial Technology (Fintech)
Financial applications demand absolute precision. A delayed transaction can cost users money and destroy trust. A Fintech company can use Prometheus to monitor the exact latency of stock price data feeds. They can track the success rate of external banking API calls. By writing custom PromQL queries, they can measure the exact milliseconds it takes to process a credit card authorization. If a third-party banking partner experiences an outage, Prometheus detects the failed connections. The system can automatically failover to a backup provider.
Gaming and Esports
Multiplayer games require incredibly low latency. Players will abandon a game if the server lags. Game studios can use Prometheus to monitor concurrent player counts across different regional servers. They can track the internal tick rate of the game physics engine. They can monitor matchmaking queue times. If the queue time in the European region exceeds two minutes, Prometheus alerts the operations team. The team can launch more game server instances in that specific region to handle the player load.
Media and Video Streaming
Video platforms move massive amounts of data. Users expect videos to start instantly and never buffer. A streaming company can use Prometheus to monitor their content delivery network. They can track cache hit ratios on edge servers. They can monitor the specific bandwidth output of individual video transcoders. If a specific video file is causing excessive disk read operations, Prometheus identifies the exact file. The engineering team can move that popular file to faster memory storage to improve playback speed.
Logistics and Transportation
Delivery companies rely on complex routing algorithms and real-time GPS tracking. A logistics team can use Prometheus to monitor the health of their fleet tracking APIs. They can track how many location updates are processed per second. They can monitor the external mapping services they rely on for route calculations. If the routing API starts returning error codes, Prometheus triggers a critical alert. Dispatchers can be notified immediately to switch to manual routing while engineers investigate the failure.
Internet of Things (IoT)
IoT networks generate an unbelievable volume of data. Thousands of small sensors constantly report their status. Prometheus is built perfectly for this high-volume ingestion. A manufacturing plant can use Prometheus to monitor temperature sensors on factory equipment. They can track the battery life of remote tracking beacons. By using the Pushgateway, low-power devices can quickly push their metrics and go back to sleep. Prometheus gathers all this data to predict when a specific machine needs maintenance before it breaks.
Telecommunications
Telecom providers manage vast networks of physical hardware. A telecommunications company can use the SNMP exporter to monitor network switches and routers. They can track packet loss across long-distance fiber optic connections. They can monitor the temperature of hardware in remote cell towers. By aggregating these metrics into a central Prometheus server, they get a holistic view of the entire national network. They can dispatch technicians to replace a failing network switch before it drops customer calls.
Healthcare Technology
Medical software must be incredibly stable. A healthcare software provider can use Prometheus to monitor the uptime of electronic health record systems. They can track the processing time of complex medical imaging files. They can monitor the secure integration points with external laboratory systems. If doctors experience slow load times when viewing patient histories, Prometheus pinpoints exactly which database table is causing the delay. This ensures medical professionals always have fast access to critical information.
Manufacturing and Industrial Automation
Modern factories are driven by software. A robotic assembly line requires constant monitoring. A manufacturing IT team can use Prometheus to track the command latency between the central control server and the robotic arms. They can monitor the network throughput on the factory floor. They can set up alerts to trigger if the error rate on a specific automated scanner exceeds one percent. This prevents defective products from moving further down the assembly line, saving raw materials and time.
Prometheus vs Other Softwares
How does Prometheus compare to other popular monitoring tools on the market? Let us look at the technical differences.
| Feature | Prometheus | Datadog | New Relic | Zabbix |
Software Model | Open-Source | Proprietary | Proprietary | Open-Source |
Data Collection | Pull (HTTP) | Push (Agent) | Push (Agent) | Push / Pull |
Query Language | PromQL | Custom | NRQL | Custom |
Storage Architecture | Local Time-Series | Cloud Proprietary | Cloud Proprietary | Relational DB |
Cost Structure | Free Software | Pay per host/metric | Pay per user/data | Free Software |
Ecosystem Integrations | Massive (Exporters) | Native Plugins | Native Plugins | Templates |
Prometheus clearly stands out. It provides the advanced query capabilities of proprietary tools without the extreme costs. It also avoids the heavy relational databases required by older open-source systems like Zabbix. You get a modern, efficient, and cost-effective monitoring engine.
Use Cases and Applications
Hosting Prometheus allows you to monitor almost anything with a network connection. Here are the most common practical applications for technical teams.
Application Performance Monitoring (APM)
You can use official client libraries for Go, Java, Python, and Ruby. You simply add a few lines of code to your application framework. This exposes internal application state directly to Prometheus. You can see exactly how many users hit a specific login function. You can track the exact duration of background email jobs. This helps you identify slow code blocks and optimize your application logic directly.
Hardware and Infrastructure Health Tracking
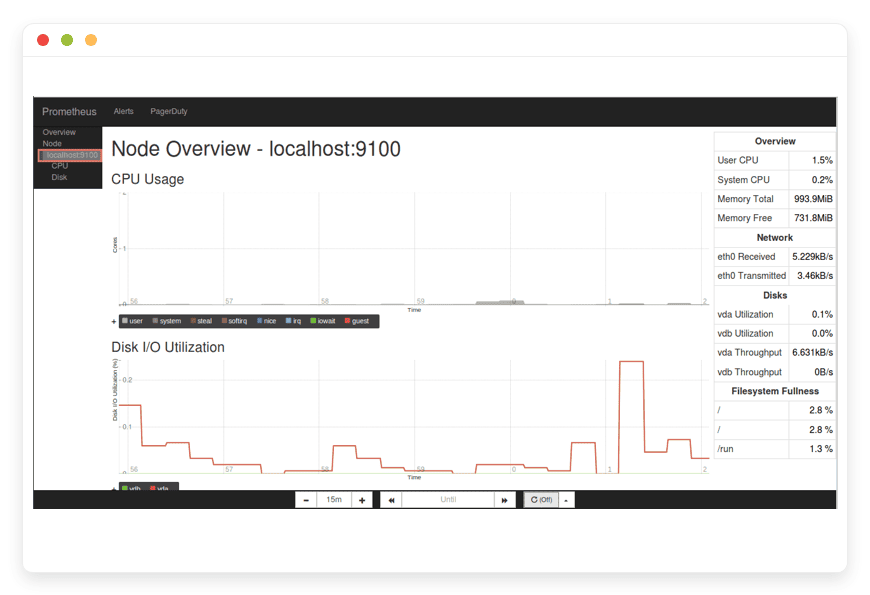
You can launch the Node Exporter on all your Linux servers. This exposes critical hardware and operating system metrics instantly. You can track CPU load averages. You can monitor available RAM. You can check Disk I/O speeds and network interface traffic. You will know exactly which machine needs more resources before it crashes from memory exhaustion. You can easily visualize this hardware data to plan your server upgrades.
Database Optimization and Tuning
Databases are almost always the bottleneck in modern web applications. You can connect the official MySQL or PostgreSQL exporter. This allows you to find the specific queries causing table locks. You can monitor active connection pools to see if your application is leaking connections. You can see your index hit rates. This allows you to optimize your database structure based on hard, mathematical data instead of guessing.
Business Metric Tracking
Prometheus is not just for technical hardware data. You can track critical business metrics alongside your system metrics. You can track total new signups per minute. You can monitor total revenue processed per hour. This allows you to correlate business events with technical events. You can see exactly if a sudden drop in sales correlates perfectly with a spike in server latency. This bridges the gap between engineering and management.
External Network Probing
You need to know what your users experience from the outside. The Blackbox Exporter allows you to probe external endpoints. You can test your website over HTTP and HTTPS. You can test DNS resolution times. You can probe raw TCP ports. The Blackbox Exporter will track exact response times. It will even monitor your SSL certificate expiration dates. It will send you an alert three days before your certificate expires, preventing embarrassing security warnings for your visitors.
How DANIAN Helps
Managing monitoring infrastructure is difficult. You have to secure the endpoints. You have to manage disk space for the massive volume of time-series data. You have to handle software updates constantly. DANIAN acts as your quiet enabler. We handle the mess; you get the glory.
Less Setup, More Development. Affordable from the Start. Real Help When You Need It.
Fully Managed: We handle the hosting. Our technical team manages everything from initial setup to regular updates, security patches, and performance monitoring. Your software is always optimized without you having to lift a finger.
Backup & Monitoring: Automated daily backups are standard. They are configured automatically, stored securely, and offer a simple one-click restore process. You never have to worry about losing your historical metric data.
SSL & Firewall: Secure by default. With cybersecurity threats on the rise, we take security seriously. From automated updates to proactive monitoring and strict network firewalls, we make sure your environment is secure 24/7.
Updates: Security patches and new version releases are applied automatically without your intervention. You always have access to the latest PromQL features and database optimizations.
24/7 monitoring: Issues are detected rapidly and often resolved entirely before you notice. Your vital monitoring system is actively monitored by us.
Guaranteed Performance: Downtime can be completely detrimental to your business operations. With our scalable infrastructure, we ensure consistent performance even as your user base grows and your metric ingestion rates skyrocket.
7-Day Free Trial: No risk involved. Test the full capabilities of the platform immediately without making a financial commitment.
How to Get Started
Getting your complete monitoring environment running takes only a few minutes. You do not need to configure complex Linux services or read massive installation manuals.
Step 1: Visit danian.co and create your new account.
Step 2: Select Prometheus from our extensive software catalog.
Step 3: Relax while DANIAN automatically starts your software and provisions your secure environment.
FAQ
What exactly is PromQL?
PromQL stands for Prometheus Query Language. It is the built-in, functional language used to select and aggregate time-series data in real-time. It allows you to build complex visual graphs and set precise mathematical alerting rules based on your collected metrics.
Does Prometheus support push metrics at all?
Yes. While Prometheus primarily pulls data, it absolutely supports pushing data via a component called the Pushgateway. This is incredibly useful for short-lived jobs or batch processes that do not live long enough to be scraped during a regular pull cycle.
How long does Prometheus store my historical data?
By default, Prometheus retains data for exactly 15 days. However, you can easily adjust this retention period via simple configuration flags based on your available disk space. Some teams retain data for years using larger storage volumes.
What is a Prometheus Exporter?
An exporter is a small piece of helper software. It fetches statistics from another existing system and formats them into readable Prometheus metrics. Common examples include the Node Exporter for Linux servers and the Blackbox Exporter for external HTTP endpoints.
Is Prometheus actually free to use?
Yes. The software itself is open-source and entirely free to use under the Apache 2.0 license. You only pay for the hosting and computing server resources required to run the application efficiently.
Can Prometheus monitor external websites?
Yes. You can use the Blackbox exporter to actively probe external endpoints over HTTP, HTTPS, DNS, and TCP protocols. It will track precise response times and even monitor your SSL certificate expiration dates.
How is Alertmanager different from Prometheus?
Prometheus evaluates your math-based alerting rules and decides exactly when a threshold is breached. It then sends a raw alert event to the Alertmanager. The Alertmanager takes over to handle grouping the alerts, silencing them, and routing them to external communication services like Slack or email.
Do I need a separate database like PostgreSQL?
No. Prometheus includes its own custom Time-Series Database (TSDB). It stores data efficiently on local disk volumes. You do not need to install or maintain any separate relational database software to make it work.
What are metric labels?
Labels are key-value pairs attached to a metric name. They add deep dimensions to your data. Instead of one metric for all errors, labels let you track errors by specific server name, HTTP method, or application version.
How often does Prometheus scrape data?
The scrape interval is entirely configurable. Most teams set it between 10 and 60 seconds. You can set different scrape intervals for different targets depending on how critical the specific system is.
Conclusion
Prometheus provides unparalleled, real-time visibility into your technical infrastructure. It replaces expensive proprietary tools with a highly reliable, open-source alternative. The multi-dimensional data model and flexible PromQL language give you the exact information you need. You can keep your applications running smoothly and fix errors before users complain.
You should spend your valuable time improving your own software. You should not spend it managing your monitoring servers. We provide the stable, secure, and fully managed environment your vital metrics require.
Experience the power of fully managed open-source


