Managed Grafana Hosting: The Ultimate Guide to Visualizing Your Data
TL;DR: Quick Answer
Grafana is the open-source standard for observability. It allows you to query, visualize, alert on, and understand your metrics no matter where they are stored. It acts as a "single pane of glass" for your entire tech stack.
Managed Grafana Hosting removes the operational pain of running this powerful tool. Instead of spending your valuable engineering hours configuring servers and debugging database connections, you get immediate access to the dashboard.
Instant Access: Skip the Linux terminal. Get a fully functional environment in minutes.
Unified View: Bring Prometheus, SQL, Loki, and other data sources into one interface.
Zero Maintenance: We handle the updates, security patches, and server health.
Secure by Default: Automated SSL, firewalls, and backups are standard.
Cost-Effective: Avoid the massive usage-based fees of proprietary SaaS platforms.
Introduction
Data is useless if you cannot understand it. In the modern software stack, your applications, servers, and IoT devices generate gigabytes of logs, metrics, and traces every single day. The problem is not gathering the data; the problem is making sense of it. You need a way to turn raw numbers into actionable insights before your users notice something is wrong.
Most developers turn to Grafana. It is the best tool for the job. It is beautiful, flexible, and connects to everything. But running it yourself is a second job.
Self-hosting observability stacks is deceptive. It starts with a simple binary download or a Docker container. It feels easy. But then you have to manage persistent storage. You have to configure the SMTP server for email alerts. You have to handle user authentication, version upgrades, and breaking changes in plugins. Suddenly, you are spending more time fixing your monitoring tool than fixing your actual product.
DANIAN acts as your invisible infrastructure team. We provide the platform so you can focus on the dashboards. We handle the messy backend work—the networking, the storage, the security. You just log in and start building.
What is Grafana?
Grafana is an open-source analytics and interactive visualization web application. Created by Torkel Ödegaard, it has evolved into the de facto standard for operational dashboards. Unlike other tools that force you to ingest data into their proprietary storage engines, Grafana is agnostic. It connects to your data where it lives.
Whether you are using a time-series database like Prometheus or InfluxDB, a relational database like PostgreSQL or MySQL, or even simple JSON files, Grafana brings it all together.
Once connected, Grafana allows you to create complex charts, graphs, and heatmaps. But it goes beyond pretty pictures. It allows you to query the data to answer specific questions. It helps you correlate events—seeing that a spike in CPU usage happened at the exact same time a new code deployment went live.
Why is it Trending?
The software world has moved from monolithic architectures to microservices and distributed systems. In the past, you could just check if a server was "up." Today, a single user request might touch twenty different services. If one of them is slow, the user experience suffers.
Observability—the ability to understand the internal state of a system based on its external outputs—is no longer optional. Grafana sits at the center of this ecosystem. It is the glue that holds the modern monitoring stack together, allowing teams to see the health of their entire architecture in one place.
Why Choose Managed Grafana Hosting?
You choose Grafana because you want freedom. Proprietary monitoring tools often trap your data in "black boxes." They charge you based on how much data you send them, punishing you for logging more details. Grafana lets you query the data where it lives, giving you total control.
However, choosing Managed Grafana Hosting is about valuing your time.
Setting up a production-ready Grafana instance is difficult. You have to consider:
Database Management: You need a backend database (usually SQLite, MySQL, or PostgreSQL) to store your dashboard configurations, users, and alerts. This database needs to be backed up and optimized.
Plugin Management: Installing plugins often requires server-level access and restarts.
Security: You must secure the login portal, set up SSL certificates, and configure firewalls to prevent unauthorized access.
Availability: If your monitoring tool goes down, you are flying blind. Ensuring Grafana itself is highly available requires complex load balancing.
When you choose a managed solution, you bypass the friction. You get the power of the open-source software without the administrative overhead. You maintain control over your data sources while we maintain the engine that visualizes them.
Key Features of Grafana
Grafana is dense with features. It is not just a graphing tool; it is a full observability suite. To truly understand why it is the industry standard, we need to look deep into its capabilities.
1. The "Explore" Workflow
Building a dashboard takes time. Sometimes you just want to ask a question. The Explore feature allows you to dive into your data without creating panels. You can write ad-hoc queries, split the view to compare two different time ranges or two different data sources side-by-side, and inspect the raw results. This is vital for debugging. You can iterate on your query in Explore mode and, once you are happy with it, export it directly to a dashboard.
2. Comprehensive Visualization Options
Grafana offers a massive library of visualization panels. It goes far beyond simple line charts:
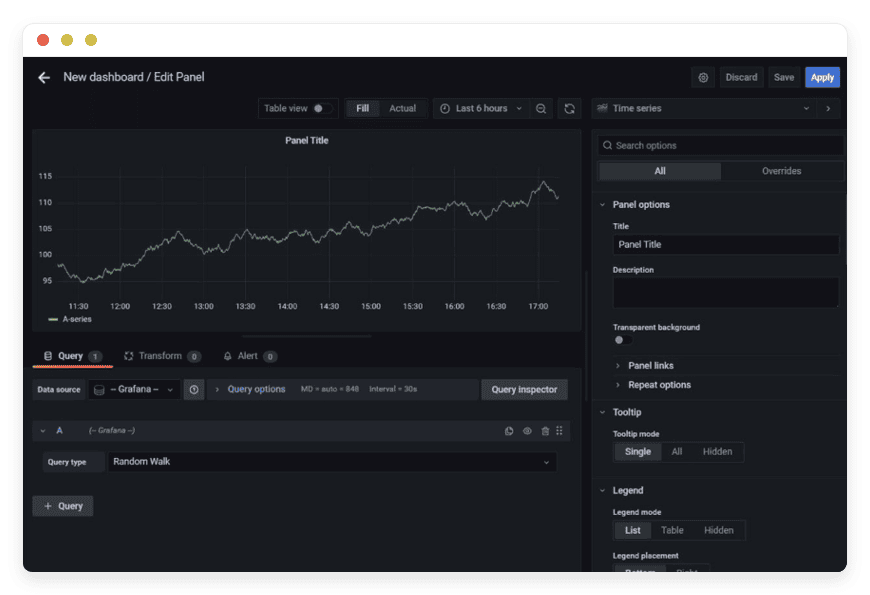
Time Series: The classic graph for CPU, memory, and network traffic. It supports multiple axes, stacking, and thresholds.
State Timeline: Perfect for visualizing status changes over time (e.g., "Up" vs. "Down" or "Starting" vs. "Running").
Geomap: Visualize data with geospatial coordinates. See where your users are logging in from or track your IoT fleet on a world map.
Bar Gauge: great for displaying instantaneous values with color-coded thresholds (green, yellow, red).
Heatmaps: Essential for understanding the distribution of data, such as visualizing latency histograms to find outliers that averages hide.
Node Graph: Visualize directed graphs to understand dependencies between services.
3. Transformations
Often, the data in your database is not in the exact format you need for your chart. In the past, you had to rewrite your database query. Grafana Transformations allow you to manipulate data within the browser after it has been fetched.
Join: Combine results from two different queries into one table.
Calculate: Perform math on the data (e.g., sum two fields, calculate the difference).
Organize Fields: Rename, reorder, or hide columns without touching the source query.
Reduce: Take many time-series data points and reduce them to a single value (e.g., the maximum value over the last hour).
4. Advanced Alerting
Looking at graphs is great, but you cannot watch them 24/7. Grafana’s unified alerting system is a powerhouse. You define rules that evaluate your metrics.
Multi-dimensional alerts: You can create one alert rule that applies to all your servers. If any server's CPU > 90%, it triggers.
Notification Channels: Grafana integrates with PagerDuty, Slack, Discord, Microsoft Teams, Email, Kafka, and generic Webhooks. You get notified exactly where your team hangs out.
Silencing: You can schedule "quiet times" during maintenance windows so you don't get woken up by expected downtime.
5. Dynamic Dashboards with Variables
This is the feature that separates amateurs from pros. Instead of creating a separate dashboard for "Server A," "Server B," and "Server C," you create one dashboard with a Variable.
This creates a dropdown menu at the top of the screen. When you select "Server A," the entire dashboard updates to show data for that server. You can chain variables (e.g., selecting "Region: US-East" updates the "Server" dropdown to show only servers in that region). This reduces maintenance and keeps your environment clean.
6. Annotations
An anomaly on a graph is useless if you don't know why it happened. Annotations allow you to mark points on the graph with context.
Manual: You can Click on a graph and leave a note: "Restarted database service here."
Automated: You can configure your deployment tools (like Jenkins or GitHub Actions) to send an API call to Grafana whenever you release new code. This draws a vertical line on your graphs. If you see CPU spike right after the line, you know the new code caused the issue.
7. Access Control and Organization
In a team environment, organization matters. Grafana supports:
Organizations: Completely separate environments within a single instance.
Folders: Group related dashboards together.
Permissions: Granular control over who can view, edit, or delete dashboards. You can have a "Public" folder for wall monitors and a "Restricted" folder for financial data.
Solutions per Industry
Grafana is not just for tech companies. Its flexibility makes it the ideal solution for any industry that generates data.
1. DevOps and Site Reliability Engineering (SRE)
This is the native habitat of Grafana. DevOps teams manage complex pipelines and containerized infrastructure.
The Pain Point: A microservice fails, causing a cascade of errors. The logs are moving too fast to read, and the "health check" endpoint still says 200 OK because the service is up, but the database connection is timed out.
The Use Case: The SRE team uses a Grafana dashboard that correlates Kubernetes Pod health with application error rates. They use the "Logs" panel (via Loki) side-by-side with the "Metrics" panel (via Prometheus). When the error rate spikes, they highlight the graph, and the logs panel automatically filters to show only the logs from that exact timeframe. They identify the database timeout in seconds, not hours.
2. eCommerce and Retail
Online stores live and die by uptime and speed. But they also need to track business logic.
The Pain Point: During a flash sale, the server load spikes. Is it a Distributed Denial of Service (DDoS) attack, or is the marketing campaign just really successful?
The Use Case: The operations team builds a "Command Center" dashboard. On the left, infrastructure metrics (CPU, Load Balancer requests). On the right, business metrics (Orders per Minute, Payment Gateway Success Rate).
The Outcome: They see load spiking, but they also see "Orders per Minute" breaking records. They know it's good traffic. They can confidently scale up resources without triggering security protocols that might block real customers.
3. Manufacturing and Industrial IoT (IIoT)
Modern factories are full of sensors. PLC controllers output temperature, pressure, vibration, and rotation speed.
The Pain Point: This data often lives in local, proprietary databases on the factory floor (SCADA systems), invisible to upper management or remote maintenance teams.
The Use Case: By connecting Grafana to the industrial time-series database (or an MQTT broker), the factory creates a digital twin of the production line.
The Outcome: A dashboard shows the temperature of the injection molding machine. They set an alert: if the vibration sensor on the conveyor belt exceeds a threshold, send an alert to the maintenance foreman. They replace a worn bearing during a lunch break instead of waiting for the belt to snap during a production run.
4. Energy and Utilities
Renewable energy creates variable data. Solar panels produce differently based on cloud cover; wind turbines depend on weather.
The Pain Point: Managing the grid requires balancing supply and demand in real-time. Operators need to know exactly how much power is being generated across thousands of distributed assets.
The Use Case: An energy provider uses Grafana to visualize the output of solar farms. They use the Geomap panel to show the status of every inverter across the state.
The Outcome: They can see a storm front moving across the map by watching power output drop in real-time. This allows them to spin up backup natural gas generators before the voltage drops, preventing brownouts.
5. Gaming Infrastructure
Multiplayer games require low latency. A lag spike ruins the experience.
The Pain Point: Players are complaining about lag, but the servers look fine. The issue might be in the matchmaking logic or a specific ISP route.
The Use Case: Game studios use Grafana to track "Tick Rate" (how fast the server updates the game state) and "Round Trip Time" for players in different regions.
The Outcome: They notice that latency is only high for players connecting through a specific internet exchange in Frankfurt. They route traffic around the problem area using their CDN, restoring smooth gameplay instantly.
6. Blockchain and Web3
Running a blockchain node requires constant vigilance. If your node falls behind the network, you lose money or voting power.
The Pain Point: Checking the status of a validator node via command line (CLI) is tedious and hard to visualize over time.
The Use Case: Node operators connect Grafana to their validator's Prometheus exporter. They track "Block Height," "Peers Connected," and "Missed Signatures."
The Outcome: An alert notifies the operator that their peer count has dropped below the minimum required for consensus. They restart the p2p service before they get "slashed" (penalized) by the network.
7. Software Development Agencies
Agencies manage dozens of client projects simultaneously.
The Pain Point: Account managers and developers waste hours every week logging into ten different hosting provider portals just to check if client sites are online and SSL certificates are valid.
The Use Case: The agency builds a "Client Health" wall monitor. It uses the Blackbox Exporter to ping every client website URL.
The Outcome: A single screen shows green boxes for 49 clients and one red box for a client whose domain registration just expired. The team calls the client to fix it before the client even notices the site is down.
Grafana vs Other Software
It is important to understand where Grafana fits compared to other software solutions. We are comparing the application capabilities here, not hosting providers.
| Feature | Grafana | Proprietary SaaS (e.g., Datadog/NewRelic) | Kibana |
| Primary Focus | Unification & Metrics | All-in-one Observability | Log Analysis & Search |
| Data Philosophy | Query Where It Lives | Ingest Everything | Ingest to Elasticsearch |
| Flexibility | Extreme (SQL, NoSQL, APIs) | Limited to Vendor Integrations | High (for Elastic stack) |
| Cost Model | Free Software / Hosting Cost | Per Host / Per GB (High) | Free Software / Hosting Cost |
| Alerting | Integrated & Rule-Based | Vendor Proprietary | Watcher (Complex) |
| Visualizations | Massive Plugin Library | Vendor Standard Set | Specialized for Logs |
| Learning Curve | Moderate | Low | High |
The Critical Difference:
The main difference lies in the "Data Philosophy." Proprietary tools force you to move your data to their cloud to see it. Grafana respects that your data is already stored safely in your databases. It simply sits on top, reading the data without moving it. This architecture is generally faster, more secure, and significantly cheaper.
Kibana is often compared to Grafana. While both are excellent, Kibana is strictly tied to the Elasticsearch ecosystem. If you have data in PostgreSQL or InfluxDB, Kibana cannot help you. Grafana can visualize Elasticsearch data plus everything else.
Use Cases and Applications
Grafana is versatile. Beyond the standard corporate monitoring, here are practical ways teams and enthusiasts use it today:
Full Stack Application Performance Monitoring (APM):
Developers use the RED method (Rate, Errors, Duration) to track the health of their HTTP APIs. By visualizing how long requests take and how many result in 500 errors, they can pinpoint bad code deployments immediately.Home Lab & Automation:
The self-hosting community loves Grafana. By connecting it to Home Assistant, enthusiasts track energy usage, room temperatures, internet connection speeds, and even the moisture levels of their house plants over months and years.Financial Trading Dashboards:
Because Grafana can ingest JSON from any API, traders use it to visualize stock trends, crypto prices, and forex rates. They overlay these price feeds with sentiment analysis data to make trading decisions.Public Status Pages:
Instead of paying for a separate status page service, companies use Grafana to build a simplified, read-only dashboard. They make this public so users can check if the system is operational.Capacity Planning:
IT managers look at long-term trends (6-12 months) of disk usage and memory consumption. Grafana's linear prediction algorithms can project when a server will run out of space, allowing procurement teams to buy hardware months in advance.
How DANIAN Helps
We are the "Quiet Enabler." You are the expert in your data; we are the experts in keeping the lights on. We handle the mess so you get the glory of a perfect dashboard.
Fully Managed
We handle the hosting. Our team manages everything from the initial launch to regular system maintenance. Your software is always running on optimized infrastructure without you having to lift a finger. You do not need a SysAdmin; you have us. We ensure the underlying Linux OS is tuned for high-throughput network traffic, which is essential for observability tools.
Backup & Monitoring
We take your data safety seriously. We configure automated daily backups that are stored securely off-site. If you make a mistake—like deleting a critical dashboard or corrupting your user database—we can restore your environment with a single click. We also monitor the health of the host itself, ensuring high availability.
SSL & Firewall
With cybersecurity threats on the rise, we take security seriously. Observability tools often contain sensitive data about your internal architecture. From automated SSL certificate updates (Let's Encrypt) to proactive monitoring and custom firewalls, we make sure your environment is secure 24/7. Your login portal is protected from day one, and we ensure only the necessary ports are open.
Updates and Performance
We apply security patches and version updates. This is critical for tools like Grafana where new features and security fixes drop regularly. Downtime can be detrimental to your business. With our scalable infrastructure, we ensure consistent performance even as your user base and data volume grow. If your team grows from 5 users to 50, our infrastructure scales to meet the demand.
7-Day Free Trial
There is no risk. You can spin up a server, connect your data, and see the value immediately. We believe the best way to understand the power of managed hosting is to experience it.
Less Setup, More Development. Affordable from the Start. Real Help When You Need It.
How to Get Started
Getting your own managed Grafana instance running is simple. We have removed the complexity of command-line installations.
Visit DANIAN: Go to our website and sign up for an account.
Select Grafana: Browse our catalog of open-source applications. You will find Grafana listed under the Monitoring category.
Launch: Click the button. Relax for a few minutes while we provision the server, secure the network, install the software, and configure the reverse proxy.
Login: You will receive your secure credentials. Log in and start building your first dashboard.
FAQ
Do I need to pay for a license?
No. Grafana is open-source software (AGPL). When you use DANIAN, you are paying for the managed hosting service, the hardware, the backups, and the support. You are not paying for the software itself.
Can I install custom plugins?
Yes. You have full administrative control over your instance. You can install any plugin available in the official Grafana repository or upload valid community plugins to visualize niche data sources.
What data sources are supported?
Grafana supports dozens of data sources out of the box. Common ones include Prometheus, InfluxDB, PostgreSQL, MySQL, Elasticsearch, CloudWatch, Azure Monitor, and Google Cloud Monitoring. If it has an API, you can likely visualize it.
Is this different from Grafana Cloud?
You have full control over the configuration, privacy, and retention policies of your instance. You are not billed based on the number of "active series" or "data ingestion," but rather on the flat rate of the hosting.
How do I upgrade to a newer version?
We handle the system-level updates. For application-level updates, we provide simple tools to ensure you are always running the latest stable version without breaking your configurations.
Can I embed charts into my own application?
Yes. Grafana allows you to share panels. You can generate an iframe code for any specific graph and embed it into your own internal tools or public websites, provided you configure the security settings to allow it.
Conclusion
Grafana is the most powerful tool available for visualizing your digital world. It brings clarity to complex systems. It turns "I think the server is slow" into "The server has 400ms latency due to a lock on the users table."
But you should not spend your limited engineering hours maintaining the tool that watches your other tools. You should be building your product, not patching your dashboard server.
Let DANIAN handle the heavy lifting. We provide the robust, secure, and managed foundation you need. You provide the creativity and the data.


