The Complete Guide to Managed Redash Hosting
TLDR: Quick Answer
Redash is a fast open-source tool that connects to your databases, helping you write SQL and build visual charts.
Managed Redash Hosting removes the hard work of server setup, routine updates, and tech maintenance from your tech team.
You get instant access to Redash without installing Docker files, setting up databases, or fixing broken background tasks.
Your team can focus solely on writing queries and viewing data, while the platform runs quietly in the background.
Skip the terminal work. Start your environment fast with a 7-day free trial at DANIAN.
Introduction
Your business creates huge amounts of data every single day. To make smart choices, your team needs a fast way to query databases and view the results. Redash solves this massive problem. It connects right to your data sources. It lets you write plain SQL. It instantly turns those query results into beautiful charts you can share. Managed Redash Hosting makes this entire process ready for your team in just minutes.
But running it yourself is a second job. Redash is a complex piece of software. It needs a web server. It needs a database to store internal details. It needs a cache system for fast loading. It needs worker systems to run background queries. Setting all this up takes many hours. Keeping it secure and running well takes daily effort. Your tech team should be building your core product. They should not be fixing a broken server on a Friday night.
This is where DANIAN steps in as your quiet server team. We handle the hard parts so you can enjoy the final product. You get a ready-to-use Redash space without touching a single code file.
What is Redash?
Redash is an open-source tool built to make data simple for everyone in your company. Arik Fraimovich created it in 2013. He built it to solve a very common problem. Teams needed a fast, simple way to write SQL, view the answers, and make dashboards. They did not want to learn complex new tools.
Instead of forcing you to use slow drag-and-drop screens, Redash loves SQL. If you can write a simple SELECT command, you can build a chart in Redash. It connects to almost any database, API, or sheet you have. You write the text. Redash gets the numbers. You pick how to show it. The process is smooth, direct, and highly effective.
Why is it trending?
The data world became too heavy over the last ten years. Many reporting tools ask for huge license fees. They demand long training times. They force you to build complex data models before you see one single chart. Teams are tired of this heavy process. Redash is popular because it goes back to the basics. It gives data analysts direct power. They can work right with their data using standard SQL. It is light, incredibly fast, and gets out of your way.
Why Choose Redash?
When you pick a data tool, you often have to choose between rigid paid software and messy free projects. Redash gives you the perfect middle ground. It gives you open-source freedom while offering a clean, professional user layout.
Hosting Redash is a smart move for teams that want a direct link to their databases. Paid software often charges you for every new user. This stops you from sharing data widely. Redash scales with your whole team. You can invite everyone in your company to view charts without worrying about huge bills. It replaces heavy, costly platforms for companies that just need clean, reliable, SQL-based reporting. It is simple, clear, and highly focused.
Key Features of Redash
Redash is built for high speed and pure focus. The screens are minimal, but the engine behind it is highly capable. Here is a deep dive into the specific features that make Redash a great tool for data teams. Each feature removes a roadblock from your daily workflow.
The SQL-First Query Editor
The heart of Redash is its text editor. It highlights your code to make reading easy. It features a helpful schema browser on the side. This browser lets you see all your tables and columns without leaving the page. It auto-completes your typing based on your exact database setup. You also get keyboard shortcuts to speed up your work. You write your SQL, press a button, and the answers appear instantly below. This saves analysts from switching back and forth between tools.
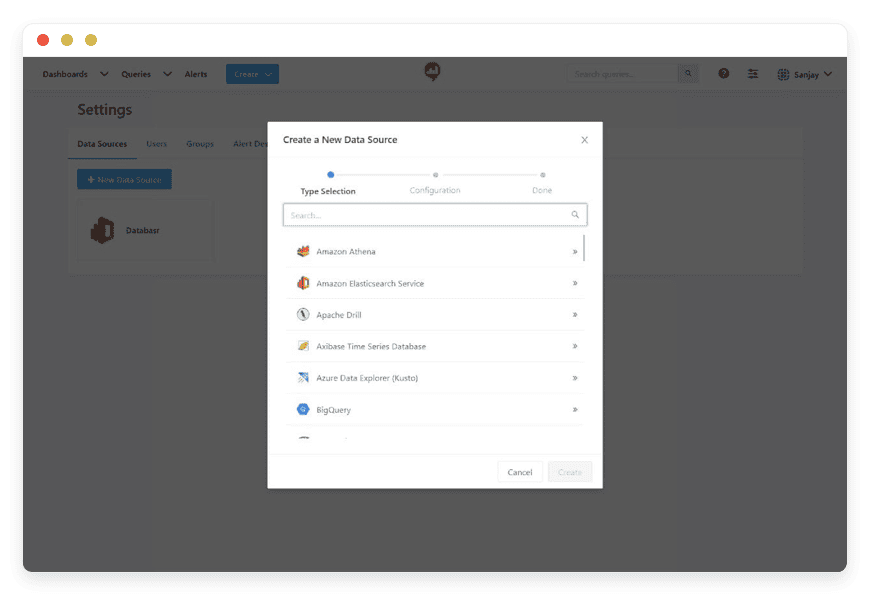
Extensive Data Source Support
Redash connects to almost everything. You can read from standard systems like PostgreSQL, MySQL, and Microsoft SQL Server. It supports cloud giants like Amazon Redshift, Google BigQuery, and Databricks. You can even read from flexible stores like MongoDB, DynamoDB, and Elasticsearch. If your data lives in a Google Sheet or an external web API, Redash can read that too. This ends the problem of data living in totally hidden silos.
Flexible Query Parameters
You do not need to write a new query every time someone asks a question. Redash supports parameters. You just add {{ parameter_name }} to your SQL text. When you do this, Redash instantly builds a clean menu widget on the screen. Your business users can pick dates from a calendar. They can pick names from a dropdown list. They can type numbers into a box. The query runs again with their new choices. They never have to see or touch the SQL code.
Lightning Fast Query Filters
Sometimes you pull a huge list of data, and you just want to slice it quickly. Query Filters let you do this. Unlike parameters that ask the database for new answers, filters work right in your web browser. You pull the data once. Then, you use a filter column to show only specific rows. This is incredibly fast. It saves your main database from doing extra work. It makes your dashboards feel quick and responsive.
Reusable Query Snippets
Writing the same exact JOIN commands over and over is boring. It also leads to spelling mistakes. Redash lets you save common pieces of code as snippets. You give the snippet a short name. When you type that short name in the editor, Redash fills in the whole block of code for you. This keeps your team consistent. It speeds up the time it takes to write complex queries.
Advanced Chart Visualizations
A giant table of numbers is hard to read. Redash gives you many ways to draw your data. Beyond normal line and bar charts, you get highly specific options. You can make Boxplots to see data spreads. You can make Word Clouds to spot common text terms. You can make Sunburst charts to see layered groups. You can map points of interest using GPS coordinates or country codes. You select the style, map the columns, and the chart updates live.
Interactive Data Dashboards
Once you have your charts, you bring them together. Redash lets you combine multiple charts into interactive dashboards. You drag and drop them on a grid. You can stretch them out or make them small. You can add simple text boxes to explain what the charts mean. If your charts use parameters, you can link them. One single date menu at the top can update ten different charts at the exact same time.
Automated Alerts and Notifications
You should not have to stare at a screen to know when numbers drop. Redash Alerts watch your query results for you. You set up simple rules based on limits. For example, if your daily sales drop below a certain number, the alert triggers. Redash will instantly send a message to your team. You can route these alerts to your email. You can send them straight to a Slack channel. You can even send them to a custom web link. This keeps your team proactive.
The Query Results Data Source
This is a truly unique power. Redash lets you query the results of other Redash queries. It uses a small, built-in SQLite engine to do this. This means you can take sales data from your PostgreSQL server, and join it with website visit data from a Google Analytics API. You join them together in memory. It acts as a fast, simple bridge between totally different systems.
Secure User Permissions and Groups
As your company grows, you need rules about who sees what. Redash handles this with clear user groups. You can create a group for the finance team. You give that group access only to the financial databases. You can make a group for marketing. They only see the marketing data. You can also define roles. Some people can write new SQL. Other people can only view finished dashboards. This keeps your data totally secure.
Full API Integration
Redash is completely open for automation. Every single action you can do in the web screen, you can do with its API. You can write simple scripts to refresh a query. You can extract data to use in another app. You can automatically create a new user account when someone joins your company. This makes Redash fit perfectly into your larger tech setup.
Solutions per Industry
Different industries face totally different data challenges. A system must adapt to the daily work of the people using it. Here is a deep look at how Redash solves specific pain points across many different business fields.
E-Commerce Operations
An online store creates huge amounts of data every minute. You have sales logs, traffic stats, and shipping details. Redash helps you bring this all together. Your data team connects to your main database. They write a simple query to track daily sales. Then, they build a funnel chart. This chart shows how many people add items to their cart, and how many actually pay. If the payment step has a huge drop, you know a bug exists. You can add a date parameter. This lets the sales team check different weeks without coding. They just pick a date from a menu. The chart updates instantly. This saves your tech team hours of daily work.
Marketing and Media Agencies
Agencies manage data across dozens of different client accounts. Logging into ten different ad platforms to build reports takes hours. Media companies like Studio71 use systems like Redash to track billions of video views. With Redash, an agency connects all client data sources into a central hub. They use the Query Results feature to merge ad spend data from a web API with sales data from a client database. The agency then builds a unified dashboard. They generate a secret sharing link. They send this link to the client. The client gets live access to their campaign stats. The agency stops making manual slide decks.
Software as a Service (SaaS)
SaaS companies live and die by user habits. A SaaS product team uses Redash to connect to their core app database. Companies like BubbleIQ connect their support tools to track product health. By writing a specific SQL command, they use the Redash Cohort chart to track returning users. They see how many people come back in the weeks following their sign-up. They set up an Alert to send a Slack message to the tech channel if the daily user count drops fast. This helps the team spot bad software updates right away. It keeps the core product growing.
Education and EdTech
Online schools and learning apps need to track student progress. Teachers need to know who is falling behind. An education platform connects Redash to their student database. They build a dashboard that shows course completion rates. They use a parameter so a teacher can pick a specific class from a list. The dashboard then shows only the grades for that class. They can map out test scores over a semester. If a certain lesson causes a big drop in scores, the school knows they need to rewrite that lesson. It makes the teaching process much smarter.
Logistics and Travel Planning
Moving goods or people involves complex timing. Companies like Stasher use Redash to manage their luggage storage network. They connect Redash to their main PostgreSQL database. They stop using messy, slow spreadsheets. The operations team builds maps in Redash to show where drop-off points are busy. They write queries to find areas that need more storage hosts. They track booking volumes by city. This gives them a clear, real-time map of their whole business. They can make fast choices about where to grow next.
Gaming Studios
Video game creators need to watch player behavior closely. If a level is too hard, players quit and never come back. A game studio connects Redash to their player event logs. They build a strict funnel chart. This chart tracks how many players start level one, finish level one, and start level two. If ninety percent of players fail at a specific boss fight, the design team sees this in Redash. They push a quick patch to make the boss weaker. They also track in-game coin purchases. This helps them balance the game economy daily.
Financial Services and FinTech
Money moves fast, and tracking it must be flawless. A payment app uses Redash to watch money flow. They connect to their safe transaction databases. They build dashboards that update every few minutes. These screens show total money moved, failed card charges, and new account limits. They set very tight Alerts. If the number of failed card charges spikes in a five-minute window, Redash sends an urgent email to the fraud team. This quick warning can save the company huge amounts of money. It provides deep trust in their system.
Real Estate Platforms
Selling homes relies on tracking market shifts and leads. A real estate firm connects Redash to their property listing database. They build a dashboard to track which city areas get the most clicks. They use a text parameter to let agents search for specific zip codes. The dashboard updates to show the average home price in that exact zip code over the last year. Agents use this live data to price new homes perfectly. They also track how many days a home sits before selling. This keeps the whole sales team sharp and aware.
Non-Profit Organizations
Charities must track every dollar to report to their donors. A non-profit uses Redash to link their web donation portal with their email system. They build simple bar charts to show how much money a specific email campaign raised. They use the Cohort feature to track donor loyalty. They see how many people who gave money in January give again in December. By seeing these trends, they know exactly when to send thank-you notes. They spend less time pulling data and more time doing their mission work.
Health and Fitness Apps
Fitness apps collect millions of daily data points from phone sensors. The app team connects Redash to their user workout logs. They build dashboards to see which workout plans are the most popular. They track the average run distance of a free user versus a paid user. They use this data to decide which new features to build. If they see that users who track their food daily are more likely to buy a premium plan, they focus their marketing on the food tracking feature. Redash turns raw logs into clear business moves.
Redash vs Other Softwares
When you pick a reporting tool, it helps to see how Redash stands against paid alternatives in the market. Redash is strictly a tool for querying and showing data. It keeps a clean SQL approach. It does not try to be a massive, rigid system.
| Feature | Redash | Proprietary Alternative (Tableau / Looker) |
Primary Tool | SQL-first query editor | Complex drag-and-drop screens |
Learning Path | Fast if you know basic SQL | Very slow platform training |
Cost Rules | Free open-source software | High fees for each new user |
Setup Speed | Very fast to start writing | Long planning and rule building |
Data Rules | Flexible direct SQL checks | Strict semantic layers required |
Best User | Data analysts and developers | Non-technical business staff |
Use Cases and Applications
Redash is highly flexible. Because it relies on standard SQL, its uses are limited only by the data you keep. Here are common ways different departments use the software every day.
Internal Financial Reporting
Finance teams use Redash to watch daily revenue, operating costs, and cash flow. By scheduling queries to run every night at midnight, the finance dashboard is completely updated before the team drinks their first coffee. They spot missing payments quickly.
Customer Support Tracking
Support leaders connect Redash to their ticketing tools. They build dashboards to watch the total ticket backlog. They track average response times for each staff member. They set alerts to text the manager if a high-level ticket remains open for more than two hours.
Core Product Analytics
Product leaders use Redash to grasp feature success. If a new button launches on the website, they write a query to track clicks on that button. They use charts to see if using the new button leads to longer session times. This proves if their work is truly helping.
System Operations Tracking
Engineering teams connect Redash to their server logs. They draw charts of error rates, server speed, and system limits. The simple layout makes it easy to pull custom data during an active crisis. They find the root cause of a bug much faster.
Human Resources Data
HR teams connect Redash to their hiring platforms. They track how many weeks it takes to hire a new person. They view applicant drop-off rates by department. They build simple tables to track team growth and training completion rates across the entire company.
How DANIAN Helps
Redash is a brilliant tool, but installing and running it is a huge chore. Redash relies on a modern, complex setup. You have to install the web app, manage a PostgreSQL database, run a Redis cache, and watch background workers. If one piece fails, your dashboards go totally blank.
DANIAN removes this entire heavy load. We act as your quiet enabler. We handle the mess of the servers. You get the glory of delivering fast, reliable dashboards to your team.
Here is what Redash Managed hosting looks like with DANIAN:
Fully Managed Hosting
We handle the hosting from start to finish. Our team manages everything from initial setup to regular updates, security patches, and performance monitoring. Your software is always optimized without you having to lift a finger. You spend zero hours reading server manuals.
Backup & Monitoring
Losing your saved queries is awful. We stop this from happening. Automated daily backups run every single day. They are configured automatically, stored securely, and ready when you need them. If you make a mistake, we provide a one-click restore. You are back to normal in minutes.
SSL & Firewall Security
Your data tool holds the keys to your company. With cybersecurity threats on the rise, we take security seriously. From automated updates to proactive monitoring and custom firewalls, we make sure your environment is secure 24/7. Your connection is locked tight.
Silent System Updates
The open-source community frequently releases great fixes. Security patches and new versions are applied without your intervention. You get the newest tools and the safest code instantly. You do not have to plan a maintenance window or run hard scripts.
Proactive 24/7 Monitoring
We watch your setup around the clock. Issues are detected and often resolved before you notice them. If a chart takes too long to load, our systems adjust the limits. We keep the background workers moving smoothly.
Guaranteed Performance
Downtime can be detrimental to your business. You cannot make choices without facts. With our scalable infrastructure, we ensure consistent performance even as your user base grows. Your screens will load fast every time you open them.
7-Day Free Trial
We want you to feel the speed yourself. No risk. No long terms. Less Setup, More Development. Affordable from the Start. Real Help When You Need It.
How to Get Started
Moving your team to a professional data space takes less than five minutes. You do not need to read long guides. Here is the fast path.
Step 1: Visit danian.co and make your clean account.
Step 2: Select Redash from our catalog of software options.
Step 3: Relax while DANIAN launches your software and secures the network.
Your secure Redash link will be live and ready for your first SQL query instantly.
FAQ
Does Redash store my actual database data?
No. Redash queries your data sources live. It only stores the direct results of your queries for a short time in its internal database for fast loading. Your raw data stays safely in your own private databases.
Can I connect many databases to a single dashboard?
Yes. You can connect as many different data sources as you want. Also, by using the Query Results feature, you can actually write a query that joins data from two entirely different databases together into one clean chart.
Is it possible to embed charts in our own software?
Yes. Redash lets you generate secret web links for your individual charts. You can place these links directly into your internal company wikis, portals, or external web tools. The charts will load there cleanly.
What happens if a scheduled query fails to run?
Redash tracks the health of all scheduled queries. If a query fails due to a bad connection or a typo, Redash logs the exact error. You can view this error message right in the query editor to fix the issue fast.
Does Redash support Python scripts?
Yes, Redash includes a Python runner option. You can write simple Python scripts to pull data from strange web APIs. You can clean that data with simple code, and pass it to Redash to draw a chart.
Why choose Managed Redash Hosting over installing it myself?
Installing Redash requires managing Docker files, a Postgres database, a Redis cache, and background workers. If you host it yourself, you are fully responsible for keeping all these parts secure and running. Managed hosting handles all of this hard work for you.
Conclusion
Redash changes how teams look at data. By focusing completely on SQL, it strips away the bloated menus of heavy data tools. It gives your analysts direct, powerful access to the facts they need. From automated alerts to clear funnel charts, it provides everything you need to build a smart, fast culture.
But you do not need to become a server expert to enjoy these massive gains. By choosing managed hosting, you ensure your team spends their time writing queries, not fixing broken setups.


