Prevent Alert Fatigue with Managed Prometheus Alertmanager Hosting
Establishing reliable metric collection for your infrastructure is only the first step. When a network switch fails and hundreds of dependent services suddenly go offline, your inbox gets flooded with a chaotic stream of notifications. Finding the root cause in that noise is completely impossible. Managed Prometheus Alertmanager Hosting solves this immediately.
TLDR - Quick Answer
What is Prometheus Alertmanager and what is the immediate value of Managed Hosting?
Centralized Alert Routing: Connects directly to your Prometheus servers to receive, organize, and route alerts to PagerDuty, Slack, OpsGenie, or email.
Smart Grouping: Condenses hundreds of identical, simultaneous firing alerts into a single, comprehensive and actionable notification.
Inhibition & Silencing: Automatically mutes lower-priority warnings when a critical system failure is already triggered, reducing alert fatigue.
Zero Maintenance: Managed hosting means you skip the complex configuration of clustering protocols, peer communication, and high-availability setups.
Instant Access: Get your environment running immediately without wrestling with terminal commands, manual updates, or infrastructure provisioning.
Introduction
Setting up metric collection is straightforward, but managing the resulting notifications is incredibly difficult. When an incident occurs, raw monitoring systems blast alerts for every single failing component. Your team receives thousands of emails and chat messages in minutes. The actual problem gets buried under an avalanche of automated noise.
You need a system to deduplicate, group, and intelligently route those alerts. But running that system yourself is a second job. Managing highly available clusters, keeping configuration files synchronized across nodes, and ensuring the alerting pipeline never goes offline requires constant attention and dedicated engineering hours.
This is where DANIAN steps in as your invisible infrastructure. We handle the technical heavy lifting. We provide a stable, secure, and optimized environment so you can focus strictly on building great software..
What is Prometheus Alertmanager?
Prometheus Alertmanager is an essential component of the broader Prometheus monitoring ecosystem. Maintained by the Prometheus authors and part of the Cloud Native Computing Foundation, it acts as the central dispatcher for all your system notifications. The software is released under the Apache 2.0 license.
While the main Prometheus server is responsible for scraping metrics and triggering alerts based on specific rules, it does not send messages directly to your team.
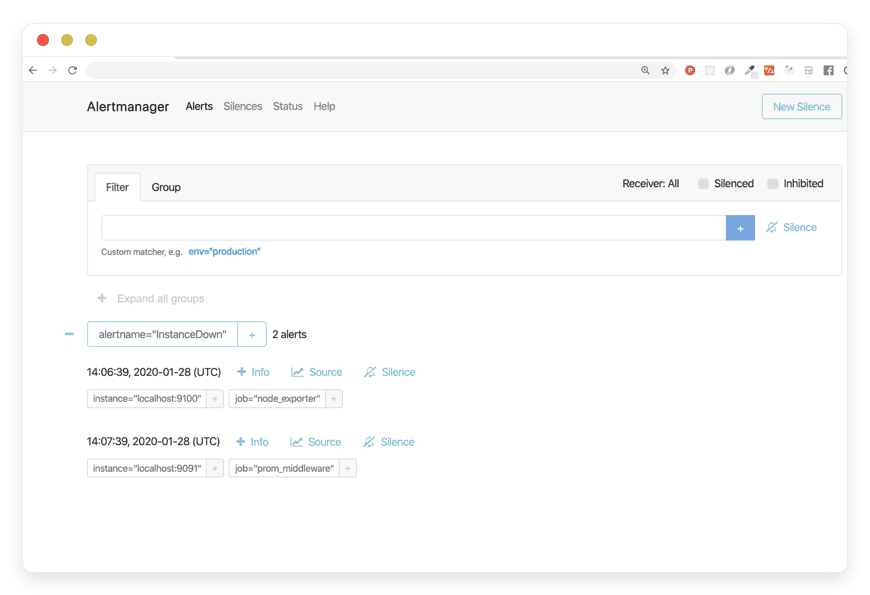
Instead, it forwards these raw alerts to Alertmanager. Alertmanager then takes over the workflow. It receives alerts from client applications, deduplicates them, groups similar issues together, and routes them to the correct receiver integration. It also handles the complex logic for silencing active alerts and inhibiting redundant warnings.
Why is it trending?
Engineering teams are managing complex microservice architectures. More services generate more metrics, which inevitably leads to more alerts. "Alert fatigue" is a massive problem in the modern tech industry. It causes engineers to ignore vital notifications because they are constantly overwhelmed by false positives and redundant warnings. Prometheus Alertmanager is trending because it directly addresses this fatigue. By organizing alerts intelligently and applying logical rules, it ensures teams only get paged for real emergencies. This keeps engineers sane and production systems stable.
Why Choose Prometheus Alertmanager?
Hosting Prometheus Alertmanager gives you complete control over your incident response pipeline. Instead of relying on rigid, closed-source tools that dictate how you handle notifications, you get absolute open-source freedom. You build the exact routing trees, matchers, and integration pipelines your specific team structure requires.
The software provides deep, unmatched flexibility. You define exactly how alerts are batched together. You set the specific wait times before an alert is pushed to your on-call management system. You control which engineering squad gets notified based on precise label matchers. By choosing this tool, you replace expensive proprietary alerting dispatchers with a flexible, community-driven standard. It integrates perfectly with your existing metrics stack.
Key Features of Prometheus Alertmanager
Prometheus Alertmanager provides a massive suite of features designed to make incident response calm and organized.
Intelligent Alert Grouping
Grouping categorizes alerts of a similar nature into a single comprehensive notification. You configure this using the group_by parameter. If a core database goes offline, dozens of microservices relying on that database will simultaneously fail and trigger alerts. Instead of sending you fifty individual emails, Alertmanager batches them based on shared labels like cluster or alertname.
Workflow Benefit: Your on-call engineer receives one compact notification showing all the exact services affected. They instantly see the larger pattern instead of drowning in isolated error messages.
Rule-Based Inhibition
Inhibition suppresses notifications for certain alerts if another specific alert is already firing. You define source_match and target_match parameters to link these events. If your entire storage cluster is unreachable, you will naturally have high-latency and connection-refusal alerts firing across the board. Alertmanager mutes all those secondary, symptom-based alerts if the primary "Cluster Down" alert is active.
Workflow Benefit: Your team focuses strictly on the root cause without being distracted by secondary noise.
Precise Silencing
Sometimes you know a system is going to throw errors. A scheduled database migration is a perfect example. Silences allow you to mute alerts for a defined period based on exact matchers. You manage these directly through the web interface or the API. You can silence all alerts for a specific environment, a specific node, or a specific service.
Workflow Benefit: This prevents false alarms from waking up your team at 2 AM for planned maintenance.
Time-Based Alert Throttling
Alertmanager provides granular control over the timing of your notifications through settings like group_wait, group_interval, and repeat_interval. When a new group of alerts is created, the system waits for the initial period to batch incoming issues. After that, it waits for the interval period before sending updates on new alerts added to that group. If an alert remains unresolved, the repeat interval determines how long to wait before resending the notification.
Workflow Benefit: Your engineers receive batched updates and regular reminders at sensible, controllable intervals.
Flexible Routing Trees
The system uses a highly configurable routing tree to decide where an alert goes. You define route blocks that evaluate the labels attached to an alert. You can route critical database alerts to a specific PagerDuty key. You can send general application warnings to a Slack channel. You can direct billing-related alerts to a dedicated email list.
Workflow Benefit: The right people get the right information immediately. You bypass unnecessary bottlenecks and avoid cross-team confusion.
Native Integrations and Receivers
Alertmanager connects natively to the tools your team already uses. It supports out-of-the-box integrations for Slack, OpsGenie, PagerDuty, VictorOps, Pushover, WeChat, and standard email. For anything else, it provides a highly reliable webhook receiver.
Workflow Benefit: You do not need to write complex translation scripts. You just paste your API keys into the YAML configuration file and the alerts flow automatically.
High Availability Clustering
When alerting is critical, a single point of failure is unacceptable. Alertmanager supports creating highly available clusters. These nodes communicate using a mesh network and a gossip protocol. If one node processes an alert and sends a notification, it immediately gossips this fact to its peers.
Workflow Benefit: If multiple Alertmanager instances receive the same alert from Prometheus, your team only gets notified once. Duplicate alerts are strictly prevented.
Alerts and Management APIs
The software exposes a robust REST API. The Management API provides endpoints for checking the health and readiness of the service. The Alerts v2 API provides structured JSON data about currently firing alerts, active silences, and receiver statuses.
Workflow Benefit: You can build custom dashboards or integrate alerting data directly into your internal developer portals.
The amtool Command Line Interface
Alertmanager includes amtool, a powerful command-line utility for interacting directly with the API. You can view currently firing alerts, add or expire silences, and test your routing configurations directly from your terminal.
Workflow Benefit: System administrators get a fast, scriptable way to manage the alerting pipeline without clicking through a web interface.
Solutions per Industry
Prometheus Alertmanager Hosting adapts to the unique operational challenges of different sectors.
eCommerce Platforms
eCommerce sites have complex architectures involving payment gateways, inventory databases, and user session stores. A sudden traffic spike during a flash sale can cause minor latency warnings across multiple systems. Using Prometheus Alertmanager, eCommerce teams group these latency alerts by specific geographical regions. If the primary checkout service fails completely, inhibition rules mute all related cart-abandonment alerts. The engineering team focuses solely on restoring the payment API.
Software Development Agencies
Agencies monitor dozens of different client applications simultaneously. Hosting Prometheus Alertmanager allows them to create distinct routing trees for each client project. If Client A's website experiences downtime, the alert routes specifically to the dedicated Slack channel for that project. Meanwhile, minor warnings for Client B are batched and sent via a daily email digest. Developers are only interrupted when immediate action is required for their specific accounts.
Financial Technology (FinTech)
In finance, uptime is critical. Security and compliance alerts are equally important. Financial institutions use Alertmanager to enforce strict separation of notification channels based on severity and category. Performance alerts route to the DevOps team. Security-related metrics, like repeated failed login attempts across a cluster, route instantly to the security operations center via an encrypted webhook.
Online Education Platforms (EdTech)
Educational platforms experience massive traffic spikes during exam seasons. A sudden influx of thousands of concurrent users puts heavy strain on the database. EdTech operations teams use Alertmanager to group database load warnings. They configure throttling rules so the database engineers receive a summary notification every 15 minutes, rather than a continuous stream of panic alerts. They also use the silencing feature extensively during scheduled summer maintenance windows.
Logistics and Supply Chain
Logistics software relies heavily on third-party APIs for shipping rates and carrier tracking. These external APIs frequently experience temporary timeouts. Supply chain engineers configure Alertmanager to catch these specific API failures. They set a very long repeat_interval for these alerts. This prevents developers from being spammed every minute while they wait for the external carrier to fix their broken tracking system.
Gaming Studios
Multiplayer game servers run on massive, globally distributed clusters. When a specific region experiences an outage, thousands of individual server instances report failures. Gaming operations teams use Alertmanager to group these alerts by the region label. If the EU-West region goes down, the EU operations team gets a single, consolidated message stating exactly how many servers are offline.
Healthcare Technology
Healthcare software requires absolute stability for patient portals and electronic health records. However, staging and development environments also generate alerts. Healthcare tech teams use Alertmanager routing trees to isolate production alerts. Critical production failures trigger immediate phone calls via PagerDuty. Staging environment failures simply log to a quiet chat channel. This keeps the focus entirely on patient-facing systems.
Marketing SaaS Platforms
Marketing platforms process massive data pipelines for analytics and reporting. When a data pipeline job fails, it often triggers downstream failures in reporting dashboards. Data engineering teams use the inhibition feature to link these events. If the core data warehouse ingestion job fails, all subsequent dashboard rendering alerts are muted. The team fixes the ingestion pipeline first, knowing the dashboards will recover automatically.
Prometheus Alertmanager vs Other Softwares
When evaluating how to handle your incident notifications, you might consider proprietary SaaS platforms. Here is how Prometheus Alertmanager compares to closed-source alerting tools.
| Feature | Prometheus Alertmanager | Proprietary Alerting SaaS |
Cost Structure | Free, open-source software. | Pay per user, per month, or per event. |
Ecosystem Integration | Native integration with Prometheus metrics. | Requires external agents and complex API setups. |
Configuration Style | Code-based (YAML), highly version-controllable. | UI-driven, often harder to track historical changes. |
Custom Routing | Infinite flexibility with regex label matching. | Pre-defined, restricted routing logic. |
Silencing Logic | Advanced matchers for surgical muting based on specific labels. | Often limited to basic time-windows or broad services. |
Choosing Prometheus Alertmanager keeps your monitoring stack open, flexible, and completely under your control.
Use Cases and Applications
Here are five practical ways engineering teams apply Prometheus Alertmanager in their daily workflows.
1. Consolidating Network Partition Errors
When a top-of-rack network switch fails, hundreds of bare-metal servers lose connectivity simultaneously. Alertmanager bundles these hundreds of "Host Unreachable" alerts into a single notification. This saves on-call engineers from severe notification spam and allows them to identify the broken switch immediately.
2. Routing by Severity Levels
You can define a routing tree based on the severity label. You configure severity="critical" alerts to trigger a phone call via an external integration. You configure severity="warning" alerts to drop a silent message into a low-priority chat channel. Engineers review the warnings during normal business hours.
3. Scheduled Maintenance Muting
Using the active silencing feature, operations teams apply a temporary rule that drops all alerts from a specific server rack. While hardware is being actively replaced, no false alarms reach the alerting channels. The silence expires automatically when the maintenance window ends.
4. Testing Alert Pipelines
Using the amtool command-line utility, developers simulate alerts matching specific labels. They verify that a newly added team's email address is correctly placed in the routing tree before pushing the configuration to the live production environment.
5. Multi-Team Notification
A single failure might affect multiple departments. A broken payment API affects both engineering and customer support. Alertmanager duplicates a specific alert and routes it to both the database team's ticketing system and the customer support team's chatroom at the exact same time.
How DANIAN Helps
Running complex monitoring infrastructure takes time away from actual development. You have to patch servers, manage SSL certificates, and ensure the disk does not fill up. At DANIAN, we act as the quiet enabler behind your stack. We handle the mess; you get the glory.
Fully Managed: We handle the hosting. Our team manages everything from initial setup to regular updates, security patches, and performance monitoring. Your software is always optimized without you having to lift a finger.
Backup & Monitoring: Automated daily backups are configured automatically, stored securely, and ready for a one-click restore. Your intricate routing configurations are always protected.
SSL & Firewall: Secure by default. With cybersecurity threats on the rise, we take security seriously. From automated updates to proactive monitoring and strict firewalls, we make sure your environment is secure 24/7.
Updates: Security patches and new versions are applied without your intervention, keeping your alerting pipeline stable and up to date automatically.
24/7 Monitoring: Issues within the hosting environment are detected and often resolved before you even notice them.
Guaranteed Performance: Downtime can be detrimental to your business. With our scalable infrastructure, we ensure consistent performance even as your metric volume grows.
7-Day Free Trial: Try it with zero risk.
Less setup, more development. Affordable from the start. Real help when you need it.
How to Get Started
Setting up your resilient alerting pipeline should be fast and painless.
Step 1: Visit danian.co and sign up for an account.
Step 2: Select Prometheus Alertmanager from our software catalog.
Step 3: Relax while DANIAN gets your software running instantly.
FAQ
Does Prometheus Alertmanager generate the alerts?
No. The main Prometheus server evaluates the metric rules against your time-series data and fires the alerts. Alertmanager simply receives, groups, and routes them.
Do I need a license for Prometheus Alertmanager?
No. It is an open-source project released under the Apache License 2.0. You only pay for the hosting resources you consume.
How does Alertmanager connect to Slack or email?
You configure receivers in the YAML configuration file. It has native support for many integrations and a generic webhook receiver for everything else. You provide the API keys or SMTP credentials, and it handles the delivery.
Can I test my routing configuration before making it live?
Yes, you can use the amtool command-line utility to simulate alerts and verify exactly which receiver they will hit based on your current rules.
What happens if I receive too many alerts at once?
You can configure alert limits per alertname to drop excess notifications. This protects your downstream receivers, like PagerDuty or Slack, from being completely overwhelmed and rate-limiting your account.
Is high availability supported?
Yes, the software supports clustering out of the box using a gossip protocol. However, when using our managed hosting, we handle the infrastructure stability and uptime for you.
Can I silence alerts via an API?
Yes. Alertmanager provides a robust REST API. You can programmatically create, query, and expire silences. This is highly useful for integrating with CI/CD pipelines to silence alerts during automated deployments.
How do I prevent one noisy service from hiding other critical alerts?
You use the grouping feature. By grouping alerts by service and environment, a noisy service will only generate one continuous notification thread. Alerts from other services will form their own distinct groups and notify you independently.
What is the difference between grouping and inhibition?
Grouping combines multiple similar alerts into one single message. Inhibition completely mutes a specific alert if another, more severe alert is currently active.
Will Alertmanager store my alert history forever?
No. Alertmanager is a dispatcher, not a long-term storage system. It holds alerts in memory while they are active. For long-term auditing, you should route alerts to a webhook that logs them into a database or use your receiver's history features.
Conclusion
Prometheus Alertmanager transforms chaotic, overwhelming notification streams into clear, actionable intelligence. It brings absolute order to complex systems by intelligently grouping, routing, and silencing alerts based on your exact specifications. By choosing managed hosting, you ensure this critical piece of your infrastructure is always online, secure, and performant. This allows your engineering team to sleep soundly and respond only when it truly matters.
Experience the power of fully managed open-source.


