Managed Metabase Hosting: Democratize Your Data Without the DevOps
TLDR - Quick Answer:
Instant Setup: Launch a fully configured Metabase server in minutes.
Zero Maintenance: No JVM tuning, manual upgrades, or server patching.
Automated Security: SSL, firewalls, and backups are standard.
Focus on Logic: Spend your time building dashboards, not fixing infrastructure.
Introduction
If you have data in a database, you have a problem. The data is sitting there, perfectly structured in PostgreSQL, MySQL, or BigQuery, but the people who need it—marketing, sales, product managers—can't reach it. They have to ask engineers to write queries. This creates a bottleneck where your technical team becomes a report-generation factory, and your business team operates on gut feeling rather than facts.
Metabase solves this. It is arguably the most user-friendly Business Intelligence (BI) tool on the market today. It lets non-technical users ask questions about data using a simple interface, while still giving analysts a powerful SQL editor. It turns a "read-only" database into an interactive playground for the entire company.
But here is the reality check: Running Metabase yourself is a second job.
While the open-source software is free, the time you spend managing it is not. You have to provision a server, install Java, tune the Java Virtual Machine (JVM) to prevent memory leaks, configure SSL certificates, set up SMTP for email alerts, and manually migrate the application database from H2 to Postgres if you want it to actually survive a restart. If the server runs out of RAM during a heavy query, it crashes. If you miss a security patch, you are vulnerable.
At DANIAN, we believe your infrastructure should be invisible. You should be looking at charts, not error logs. We provide fully managed hosting that just works, allowing you to bypass the setup phase entirely.
What is Metabase?
Metabase is an open-source business intelligence tool that lets you create charts and dashboards from data in your existing databases. It was built on a simple philosophy: you shouldn't need to know SQL to understand what is happening in your company.
It connects directly to your databases (Postgres, MySQL, Mongo, Snowflake, SQL Server, and many others) and offers two primary interfaces:
The Query Builder: A graphical interface where you filter, group, and aggregate data by clicking buttons.
The Native Query Editor: A full SQL IDE for complex analysis.
Why is it trending? Because it respects the intelligence of the user without demanding technical skills. It allows a CEO to check daily revenue on their phone, while a data scientist writes complex joins on the same platform. It creates a "shared brain" for the company.
The Rise of "Self-Service" Analytics
In the past, BI tools were expensive, clunky, and required certification to use. You had to define complex schemas and "cubes" before you could draw a single bar chart. Metabase changed the game by being intuitive. It reads your database schema automatically and guesses the relationships. It allows teams to move from "I think this is happening" to "The data shows this is happening" in seconds.
Why Choose Managed Metabase Hosting?
You might be tempted to run Metabase on a spare server in your office or a cheap VPS. For a hobby project, that is fine. For a business, it is a liability.
Managed Metabase Hosting transforms the tool from a technical project into a reliable service. When you choose a managed solution, you are paying for reliability and speed. Metabase releases updates frequently—often multiple times a month. These updates contain critical security patches, performance improvements, and new features like AI integration and improved visualizations.
If you self-host, upgrading is a manual process. You have to download the new JAR file, stop the service, swap the files, run database migrations, and pray nothing breaks. With managed hosting, this happens automatically or with a single click.
Furthermore, Metabase runs on the Java Virtual Machine (JVM). JVMs are notorious for being resource-hungry. If not configured correctly, your BI tool will crash right before your Monday morning meeting. A managed host pre-configures the environment for stability, ensuring your dashboards load fast every time.
Key Features of Metabase
Metabase is packed with features that rival expensive enterprise software. It strikes a balance between simplicity for beginners and depth for data analysts. Here is a deep dive into the functionality that makes it the go-to choice for modern teams.
The Visual Query Builder
This is the heart of Metabase. It allows users to "ask questions" of their data without writing a line of code. You select a table (e.g., "Orders"), filter it (e.g., "Total is greater than $50"), and summarize it (e.g., "Count by Month"). Metabase instantly visualizes the result.
The magic here is that it writes optimized SQL in the background. It understands joins, so if you want to group orders by "Customer City," Metabase automatically joins the Orders table to the Customers table based on the foreign keys it detected. It empowers non-technical staff to explore complex relationships safely.
Automatic "X-Rays"
Sometimes you don't even know what question to ask. Metabase includes a feature called "X-Rays." If you click on a table, Metabase will automatically generate a dashboard of insights based on the data type.
For example, if you X-Ray a "Users" table, it might automatically show you the growth rate of signups, the geographic distribution of users, and the most common email domains. It acts as an automated data analyst, giving you a starting point for exploration.
SQL Editor with Variables and Snippets
For power users, the SQL editor is robust. It supports variables, allowing you to create template queries. For example, you can write a complex query for "Sales by Region" and leave a variable for {{Region}}. Non-technical users can then use a dropdown menu above the chart to switch between "North America" and "Europe." The chart updates instantly without the user needing to touch the code.
Additionally, you can save "Snippets" of SQL code. If you have a complex way of calculating "Net Revenue" that involves subtracting refunds and tax, you can save that logic as a snippet. Other analysts can then reuse that snippet in their queries, ensuring that everyone in the company calculates revenue exactly the same way.
Interactive Dashboards & Drill-Throughs
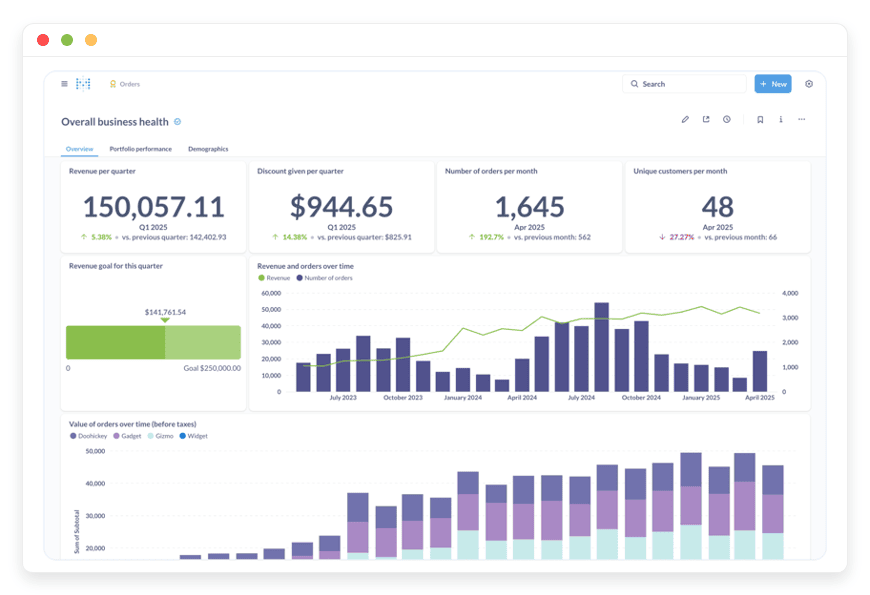
You can combine multiple questions into a single dashboard. These aren't just static images; they are interactive applications.
Global Filters: Add a date filter to the top of the dashboard. When a user selects "Last 30 Days," every chart on the page updates to reflect that timeframe.
Click-to-filter: If you click on a bar in a bar chart representing "California," the rest of the dashboard filters down to show data only for California.
Drill-through: This is a critical feature for investigation. If you see a spike in a line chart, you can click that specific point and select "View these records." Metabase will take you to a list view of the exact rows in the database that made up that number. You go from high-level trend to granular detail in one click.
Pulses and Alerts
Data is only useful if you see it when it matters. Metabase allows you to set up "Pulses"—automated updates sent via email or Slack. You can schedule a report of "Daily Active Users" to arrive in your team's Slack channel every morning at 9:00 AM.
Beyond scheduled reports, you can set up threshold alerts. You can tell Metabase to watch a specific metric, such as "Server Error Rate." If the result of that question goes above a certain number, Metabase will proactively email you. This turns the tool into a monitoring system as well as a BI tool.
The Data Reference (Data Dictionary)
Advanced Formatting
Presentation matters. Metabase allows for deep customization of how data is displayed.
Conditional Formatting: You can set rules for tables, such as "If the value is negative, color the cell red." or "Highlight the top 10% of values in green." This makes scanning large tables for outliers much faster.
Currency and Dates: You can force specific formatting for currencies, decide how many decimal places to show, and format dates to match your local standards (e.g., DD/MM/YYYY vs MM/DD/YYYY).
Solutions per Industry
Metabase is industry-agnostic. It doesn't care if your database holds patient records, shoe sales, or IoT sensor logs. However, the way it solves problems varies by sector. Here are detailed scenarios of how different industries utilize Managed Metabase Hosting.
E-Commerce and Retail
The Pain Point: Inventory drift and "blind" marketing spend.
Retailers often have data scattered across Shopify, Google Ads, and a warehouse management system (WMS). They struggle to connect ad spend to actual profit margins because the data lives in silos.
The Solution:
An e-commerce brand uses Metabase to consolidate these sources into a single view.
Inventory Velocity: They build a dashboard that tracks how fast specific SKUs are selling compared to their lead time. If "Blue Shirts" sell 50 units a day and take 10 days to restock, Metabase triggers an alert when stock drops below 600 units.
Cohort Analysis: Using the SQL editor, they calculate Customer Lifetime Value (LTV) by cohort. They can see that customers acquired via Instagram in November spend 30% more than those acquired via Google Search. This allows them to reallocate their marketing budget instantly.
Return Rates: They visualize return rates by product category, identifying a specific manufacturer that has quality control issues before it destroys their reputation.
Logistics and Supply Chain
The Pain Point: Inefficient routing and fuel wastage.
Logistics companies generate massive amounts of data from GPS trackers, fuel cards, and delivery timestamps, but this data is often too high-volume to analyze in Excel.
The Solution:
A logistics firm connects Metabase to their fleet database.
Route Efficiency: They visualize the difference between "Estimated Time of Arrival" and "Actual Arrival." By grouping this data by driver and region, they identify that a specific route in the city center consistently has delays between 4 PM and 6 PM. They adjust delivery windows accordingly.
Fuel Consumption: They create a scatter plot comparing "Miles Driven" to "Fuel Consumed" for each vehicle. Outliers immediately indicate vehicles that need maintenance or drivers with inefficient driving habits (idling too long).
** SLA Monitoring:** They have a dedicated dashboard showing "On-Time Delivery Rate" in real-time. This dashboard is displayed on a TV screen in the dispatch office, keeping the operations team aligned on daily goals.
Marketing Agencies
The Pain Point: The "Reporting Week" nightmare.
Agencies often spend the first week of every month manually downloading CSVs from Facebook, LinkedIn, and Google, pasting them into spreadsheets, and making screenshots for client PDFs. It is unbillable administrative work.
The Solution:
Agencies use "Hosting Metabase" services to automate client reporting.
Client Portals: They set up a dashboard for each client. Using Metabase's "Collections" feature, they ensure Client A cannot see Client B's data.
Live Data: Instead of a static PDF, they give the client a login. The client can check their campaign performance on Tuesday regarding the previous weekend's spend without calling the account manager.
Cross-Channel Aggregation: The agency uses SQL to join data from Facebook Ads and the client's CRM. They can prove that the 500 leads generated on Facebook resulted in 50 actual closed deals, proving the ROI of their services definitively.
FinTech and Financial Services
The Pain Point: Fraud detection and reconciliation lag.
Waiting for end-of-month reports to spot transaction errors or fraudulent patterns is too late. FinTechs need to see money moving in near real-time.
The Solution:
A FinTech startup connects Metabase to a read-replica of their transaction database.
Fraud Patterns: They build a dashboard that flags unusual activity, such as a single user making 10 transactions in one minute or a sudden spike in withdrawals from a specific IP address range.
Merchant Analytics: They provide their product managers with data on which features merchants use most. Do they use the invoicing tool? Do they use the mobile app? This usage data drives the product roadmap.
Reconciliation: They automate the comparison between their internal ledger and the payment processor's settlement reports. Any discrepancy appears on a "Red Alert" dashboard, allowing the finance team to investigate immediately rather than months later.
Education (EdTech) and Universities
The Pain Point: Student retention and engagement.
With the shift to online learning, institutions have data on every click a student makes, but they struggle to translate that into student success.
The Solution:
An EdTech platform uses Metabase to track learner progress.
At-Risk Identification: They analyze course completion rates. If a student hasn't logged in for 7 days or has failed three consecutive quizzes, they appear on a "High Risk" list for academic advisors. This allows for proactive intervention before the student drops out.
Content Efficacy: They analyze which video lectures have the highest drop-off rates. If 50% of students stop watching a video at the 4-minute mark, the content team knows that specific section is confusing or boring and can re-record it.
Enrollment Trends: Admissions teams visualize application demographics year-over-year to identify underrepresented regions and target recruitment efforts more effectively.
Manufacturing
OEE Tracking: They visualize Overall Equipment Effectiveness (OEE) for each production line. They can see that Line 4 is running at 85% efficiency while Line 2 is only at 60%, prompting an investigation into Line 2's calibration.
Defect Analysis: They track defect rates by shift. If the night shift consistently has a higher defect rate than the day shift, they can investigate training gaps or lighting issues on the factory floor.
Maintenance Forecasting: By correlating vibration sensor data with machine failure logs, they can predict when a bearing is about to fail and schedule maintenance during a planned break, avoiding costly unplanned downtime.
Real Estate and Property Management
The Pain Point: Vacancy tracking and maintenance costs.
Property managers juggle hundreds of units and need to balance occupancy with maintenance spend.
The Solution:
A property management firm centralizes their data in Metabase.
Vacancy Aging: They visualize how long units stay vacant by neighborhood. If one building takes 45 days to lease while others take 15, they know they have a pricing or condition issue.
Vendor Analysis: They analyze maintenance costs by vendor. If Plumber A charges 20% more on average for the same "toilet fix" job than Plumber B, they shift their contracts to the more cost-effective vendor.
Rent Roll Forecast: They project future cash flow based on lease expiration dates, allowing the finance team to plan for periods of lower revenue.
Metabase vs Proprietary Software
It is important to understand where Metabase fits in the landscape. We are comparing it here to proprietary software applications, not hosting providers.
| Feature | Metabase (Open Source) | Proprietary Alternatives (Tableau, PowerBI) |
| Cost | Free software (pay only for hosting/management) | Expensive per-user licensing fees |
| Setup | Launch in minutes via managed hosting | Complex installation or heavy desktop apps |
| Learning Curve | Low (Intuitive UI) | High (Requires specific training/certs) |
| SQL Access | First-class citizen | Often hidden or difficult to use |
| Flexibility | High (Embed anywhere) | Restricted ecosystem |
| Community | Massive open-source community | Vendor support only |
| Portability | Export logic, own your data connection | Difficult to migrate away (Vendor Lock-in) |
Metabase wins on agility and cost-efficiency. While tools like Tableau have their place in massive legacy corporations that require pixel-perfect printed reports, Metabase is the standard for agile companies that want answers now. It removes the licensing barrier, allowing you to give BI access to 100 employees without your bill skyrocketing.
Use Cases and Applications
Beyond the standard charts, here is how teams are using Metabase in the wild to solve unique challenges:
Financial Reconciliation: Companies connect Metabase to both Stripe and their bank ledger database. They write a query to join these tables and spot discrepancies automatically, saving accountants days of manual Excel matching.
Operational Health: Engineering teams use Metabase to monitor application logs. They visualize "API Response Time" and "Error Counts" to spot performance regressions after a new code deployment.
Product Analytics Funnels: Product managers track the "funnel" of how many users sign up, how many complete onboarding, and how many eventually pay. They use Metabase to segment this funnel by "Traffic Source" to see which marketing channels bring in high-intent users.
Customer Support Gamification: Support leads build a dashboard that shows "Tickets solved per agent" and "Average response time" in real-time. Displaying this on a shared screen helps gamify the work and motivates the team to hit daily targets.
Audit Logs: Security teams use Metabase to keep a visual record of sensitive actions taken within internal admin panels. If an admin changes a user's password, it is logged in the database and visualized on a security dashboard for compliance.
How DANIAN Helps
We are the quiet enabler. You want the power of Metabase, but you don't want the headache of Linux server administration. We handle the mess; you get the glory.
Fully Managed
We handle the hosting. Our team manages everything from initial setup to regular updates, security patches, and performance monitoring. Your software is always optimized without you having to lift a finger. We specifically tune the environment to handle the Java requirements Metabase needs, adjusting the JVM heap size and garbage collection settings to ensure smooth operation.
Backup & Monitoring
We configure automated daily backups, stored securely off-site. If you accidentally delete a critical dashboard or a bad migration corrupts your settings, we offer a one-click restore. We monitor your instance 24/7. Issues are often detected and resolved before you even notice them. We track CPU spikes and memory usage, proactively scaling resources if your data needs grow.
SSL & Firewall
With cybersecurity threats on the rise, we take security seriously. From automated updates to proactive monitoring and custom firewalls, we make sure your environment is secure 24/7. Your connection is encrypted via SSL by default, ensuring that sensitive business data remains private as it travels from your server to your browser. We lock down the ports so only the necessary traffic can reach your instance.
Updates and Maintenance
Metabase evolves fast. We ensure you are never left behind. When a new stable version is released, we apply the update for you. This includes critical security patches that protect your data from new vulnerabilities. You get the new features—like the latest charting options or faster query engines—applied without your intervention.
Guaranteed Performance
Downtime can be detrimental to your business. With our scalable infrastructure, we ensure consistent performance even as your user base grows. If your team expands from 5 to 50 users, or if your dataset grows from gigabytes to terabytes, we provide the underlying power to keep your queries running fast.
7-Day Free Trial
We believe in the product. You can spin up a server, connect your data, and see the value before you pay a cent. There is no risk. We want you to experience the speed of a properly tuned Metabase instance.
How to Get Started
Getting your own private BI server running takes less time than making a cup of coffee. We have stripped away the complexity of command lines and config files.
Sign Up: Visit danian.co and create your account.
Select Metabase: Choose Metabase from our catalog of open-source applications.
Launch: Click start. We provision the server, install the software, configure the database, and secure the network.
Connect: Log in to your new Metabase instance, plug in your database credentials, and start building charts.
FAQ
1. Is this the open-source version of Metabase?
Yes. We host the powerful open-source edition of Metabase, giving you full control without the licensing fees of the Enterprise edition. You get all the core features: dashboards, SQL editor, pulses, and embedding.
2. Can I connect to a database on my local computer?
Metabase needs to "see" your database. If your database is on a local machine behind a residential firewall, you will need to expose it to the internet or host your database in the cloud (AWS RDS, Google Cloud SQL, etc.). We provide static IPs so you can allowlist our servers to access your database securely through your firewall.
3. Do you charge per user?
No. Unlike SaaS BI tools that punish you for growing your team, DANIAN charges for the server resources (CPU/RAM). You can have as many users as your server capacity can handle. This is a massive cost saving for growing teams.
4. How do I upgrade Metabase?
We handle it. When a new stable version is released, we apply the update during a maintenance window. You get the new features without the downtime risk or the need to run migration scripts manually.
5. What happens if I want to leave?
You are never trapped. You can export your Metabase application data (questions, dashboards, collections) at any time. Since Metabase is open-source, you can take that data and run it on your own server or another provider.
6. Is my data secure?
Yes. We do not store your actual business data; we only host the Metabase application that connects to your database. The application database (which stores your users and dashboard configurations) is backed up daily. All connections are encrypted via SSL.
Conclusion
Data is the lifeblood of modern business, but only if you can understand it. Metabase breaks down the walls between your database and your decision-making. It is powerful, beautiful, and intuitive. It empowers the marketing intern to find answers without bugging the CTO, and it empowers the CTO to visualize system health without writing custom scripts.
However, the value lies in using the tool, not managing the server it runs on. The hours spent debugging Java memory errors or updating SSL certificates are hours not spent analyzing your business growth.
By choosing managed hosting, you ensure that your analytics platform is secure, fast, and always available. You save money on DevOps hours and gain peace of mind knowing that experts are watching the infrastructure.
Don't let technical hurdles stop you from seeing the big picture.


